By: Louisa Gaylord
The eScience’s Data Science Incubator program kicked off last week, which enables new research discoveries by bringing together data scientists and domain scientists to work on focused, intensive, collaborative projects. Our team of data scientists provide expertise in state-of-the-art technology and methods in large-scale data manipulation and analytics, cloud and cluster computing, statistics and machine learning, and visualization to help researchers extract knowledge from large, complex, and noisy datasets. In the seven years since the Winter Incubator program launched, eScience has collaborated on 50 total projects from a hugely diverse range of UW departments and units.
This year, we selected seven projects to further explore data science as it applies to the areas of oceanography, political science, atmospheric sciences, environmental sciences and biology.
“Using Gliders to Observe Submesoscale Flows”
Project Lead: Dhruv Balwada, School of Oceanography, College of the Environment
Data Science Lead: Rob Fatland

Since the industrial revolution 25-30% of the human-created carbon and 90% of the excess heat in the earth system has been sequestered into the deep ocean. A lot of this tracer (like heat, carbon and oxygen) transport from the surface into the interior takes place synoptically in narrow filaments (sub-mesoscale flows), which then merge and mix together at depth to result in a mean increase in amount of tracer at depth. To study the dynamics of these structures we need to make observations that span the depth of the water column and are collected at scales of a few kilometers and hours. This is possible using gliders, which profile the ocean on a zig-zag path as the move up and down through the water column.
The goal of this project is to develop tools to better explore these glider data sets. In particular we want to:
- Develop a mapping algorithm to map from the scattered space-time observations collected by the glider to a grid, which is easier to visualize and conduct analysis on, and also respects the structural properties of the fields.
- Develop a visualization dashboard for the glider, which allows for an interactive analysis of the data such as co-locating multiple variables to get a deeper insight into how observed structures might be generated.
“The Universe of International Treaties”
Project Lead: Bree Bang-Jensen, Department of Political Science
Data Science Leads: Jose Hernandez and Spencer Wood
The greatest challenges of the 21st century are cross-national, including climate change, migration, epidemics, inequality and financial corruption. As a result, it is critical that we better understand the factors that endanger international cooperation. Despite a wealth of research on how the design of international treaties affects treaty commitment and compliance, we only have snapshots of how delegation to third parties, enforcement, and precision differ across treaties. Because most treaties are publicly available text documents, this research area provides a veritable goldmine for the application of cutting edge NLP/machine learning tools—trained on highly curated datasets—to the messy, real world data of most interest and value to addressing pressing social science questions.
We will work to identify the frequency of these different elements of treaty design and legalization with the help of a stratified sample of 2,000 human labeled treaties. We might use these human labels to create a supervised machine learning model that then can predict labels for the universe of 55,000 treaties. Alternately, we may use natural language preprocessing strategies to handle the idiosyncrasies of these data. This project will help future treaty negotiators better understand the features of legalization that improve treaty durability and compliance and thus draft treaties that better contribute to cooperative outcomes, and second, detailed data on treaty design will enable other researchers in political science, sociology, economics and international law to research questions and test hypotheses that are currently not possible to explore due to limited data.
“Machine Learning-Based Dry Thunderstorm Forecast Model”
Project Lead: Wei-Yi Cheng, Department of Atmospheric Sciences
Data Science Lead: Scott Henderson
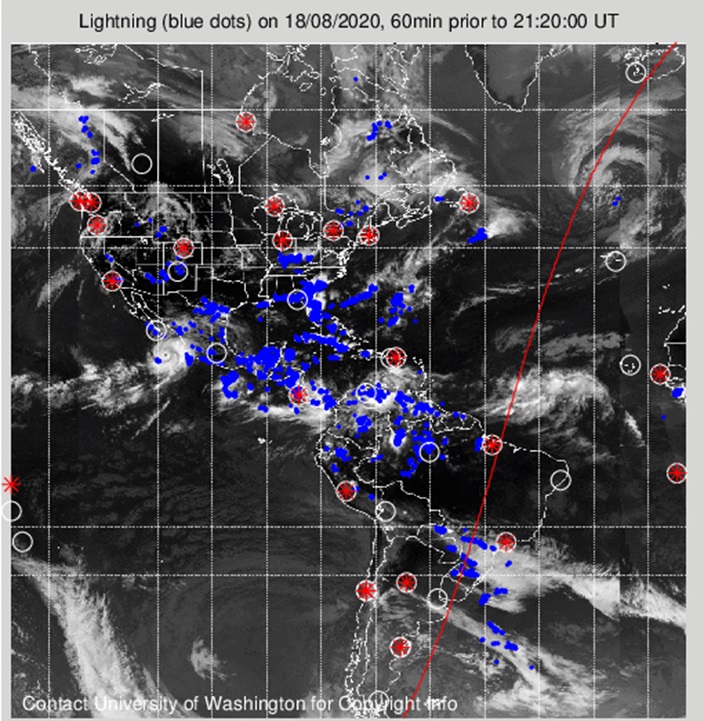
Lightning is a fascinating phenomenon, but is also a serious threat to human society. Lightning is known to be capable of triggering devastating wildfires in vegetated regions, threatening numerous communities and ecosystems with far-reaching impact in public health and economics. During 2007-2011, U.S. local fire departments estimated an average of 22,600 fires per year that were started by lightning. The lightning-induced wildfires, while happened relatively less frequently, often spread over a much wider area than the ones caused by human, because many of the lightning-induced wildfires occurred in wilderness areas and can spread rapidly unnoticedly.
The lightning-induced wildfires has drawn much attention during the past decades because it is one of the fast-growing natural hazards in most region of the United States. One of the major factors that drives the increase in the lightning-induced wildfire events is because global warming has created a warmer and drier environment in the wildfire-prone area, leading to a higher frequency of “dry thunderstorms”. Dry thunderstorms, traditionally defined as the storms that produce less than 2.5 mm of rainfall, are notable for spreading wildfires for two reasons: (i) they are one of the most common natural origins of wildfires, because there is very little rainfall to prevent the fires from spreading, and (ii) the evaporating precipitation causes excessive cooling of the air beneath the storm, which increases the density of the air as the air descends. When reaches the ground, the evaporatively cooled air spread out horizontally and produce strong gusty surface winds, which help the spread of the fires.
This project aims to improve the dry thunderstorms forecast skill. A supervised ML-based dry thunderstorm forecast model is employed by using the observational lightning data from World-Wide Lightning Location Network (WWLLN) and various atmospheric state variables as features.
“Learning to See the Forest and the Trees: Using Computer Vision to Make Forest Stewardship More Accessible”
Project Lead: David Diaz, School of Environmental & Forest Sciences
Data Science Lead: Valentina Staneva
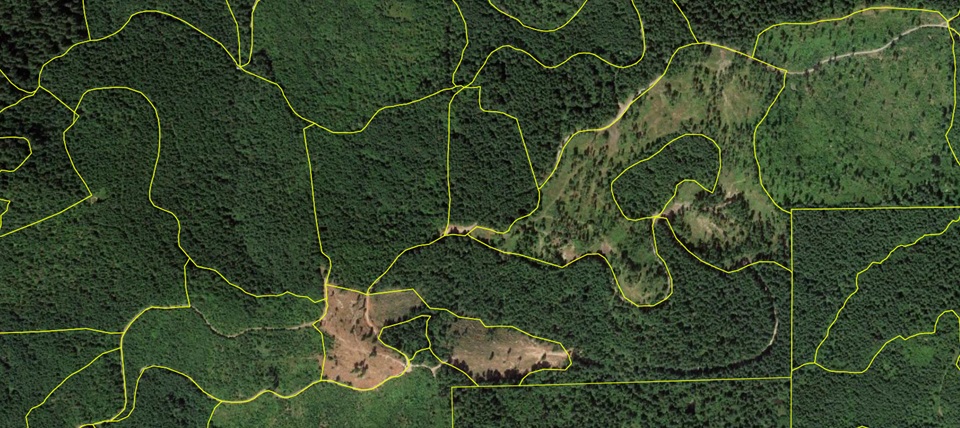 Maps that delineate and classify forest conditions remain indispensable prerequisites for forest stewardship planning. By developing new reproducible and open-source methods to automate forest mapping, our effort is designed to facilitate conservation and management planning among the 40,000+ non-industrial forest landowners in Oregon and Washington who control over 3 million acres of land. Social science research suggests more than 70% of these owners have strong stewardship attitudes, but are not (yet) engaged in any conservation or management activities. Developing a written stewardship plan is a critical bottleneck for many of these landowners before they can adopt new practices or access state and federal cost-share and incentive programs for implementing new conservation practices.
Through public records requests, forest stand boundaries hand-drawn by state and federal foresters across several million acres covering the Pacific Northwest’s diverse ecoregions have been gathered. These data provide the targets we will use to train modern computer vision models to delineate and classify forest conditions from publicly-available aerial and satellite imagery. The maps we generate will be served to landowners and forest managers across Oregon and Washington through an open-source web app designed to auto-populate Forest Management Plans following widely-used state and federal templates.
“Climate Adaptation for Future Maize – Novel Plant Traits and New Management”
Project Lead: Jennifer Hsiao, Department of Biology
Data Science Lead: Bryna Hazelton
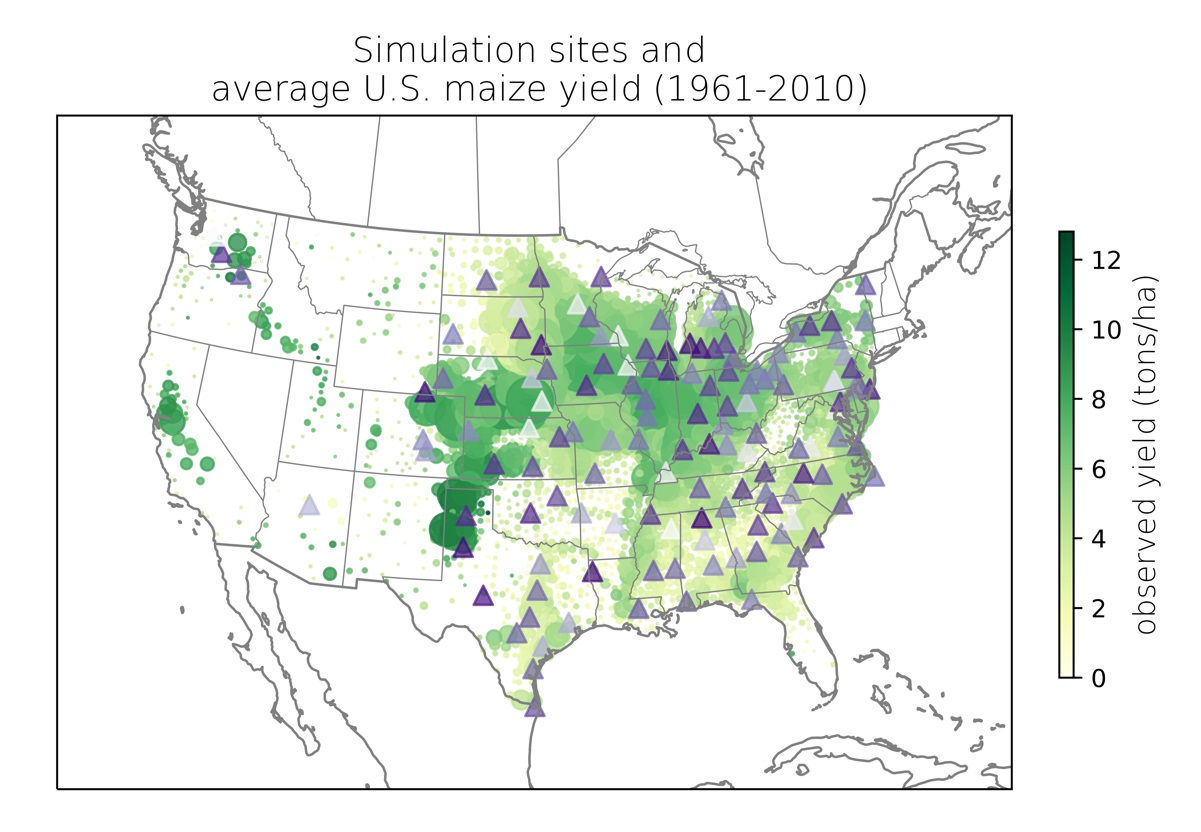 Over the next three decades rising population and changing dietary preferences are expected to increase food demand by 25–75%. At the same time climate is also changing — with potentially drastic impacts on food production. Changes in crop characteristics and management practices have the potential to partially mitigate yield loss due to a changing climate. However, a substantial knowledge gap remains for which of these adaptation techniques are likely to be most effective at any point in time, the mechanisms through which they can mitigate yield loss, and the relative effectiveness of different approaches.
In this project, we use a process-based crop simulation model to explore how different crop traits and agricultural management options affect maize growth and yield, with the hope to identify ideal trait and management combinations that maximize yield and minimize risk for different agro-climate regions in the US. We hope this work will shed light on region-specific adaptation strategies for US maize facing a changing climate.
“Detecting Wildflowers in Spectral Imagery”
Project Lead: Aji John, Department of Biology
Data Science Leads: Nicoleta Cristea and Amanda Tan
Alpine wildflowers are an integral part of montane ecosystems; they provide a wide variety of ecosystem services like pollination and nutrient recycling. Numerous studies have found that these wildflower species are sensitive to climate warming as their flowering phenology (development stage) is strongly related to snowmelt. To understand the effects of climate change on these vulnerable wildflowers, records of various stages of development are required: MeadoWatch is one of the citizen science initiatives run by Janneke Hille Ris Lambers (JHRL) lab at UW that has spearheaded the effort of documenting stages for the past 8 years. Volunteers visit the sites along two popular trails on the south and east side of Mt. Rainier from bud break to post flowering. The program has so far been successful in raising awareness of climate change on wildflowers and being a natural history conduit to staff at Mt. Rainier National Park.
At the beginning of 2020, a related initiative was started whereby field images of meadow flowers were captured alongside hyperspectral imagery from hoisted drones. The goal was first to improve remotely sensed phenology detection of these meadows, and secondly to complement citizen science observations by capturing finer spectral signatures of meadow flowers such that it can be then cross-evaluated with imagery from satellite providers (e.g., Planet, Sentinel-2 and Landsat 8). However, to understand and derive field observed spectral signatures, there is a need to delineate and demarcate flowers from heterogeneous backgrounds (e.g., trees, leaves, soil, rocks, etc.). We plan to delineate meadow flowers from complex backgrounds like rocks, soil and leaves using Convolutional Neural Nets (CNN) as they have shown promising results on ImageNet-based datasets. The results would assist in better prediction of wildflower season which can complement citizen science efforts and park visitor management.
“Using Social Media to Model Backcountry Use in Rainier National Park”
Project Lead: Gabe Wisswaesser, School of Environmental & Forest Sciences
Data Science Lead: Spencer Wood
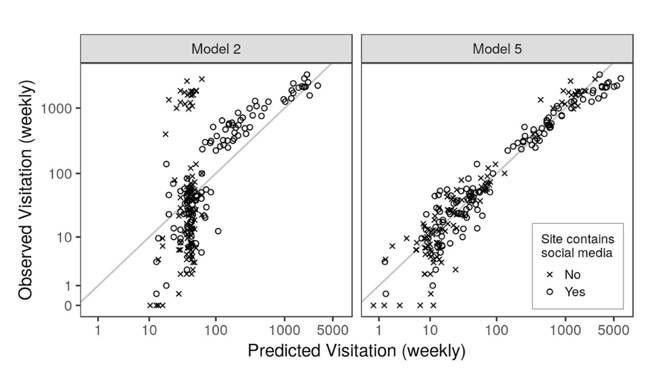 As public land use increases, accurate visitation numbers are paramount to managers and researchers interested in mitigating and understanding anthropogenic effects. Alpine water quality, as of late, has been under exceptionally high pressure because backcountry use is exceeding human waste mitigation. Data concerning backcountry visitation is sparse, and attempts to model it accurately on the national park scale is an essential next step in quantifying use. This incubator project is testing approaches for using publicly available, geotagged, social-media data, and other variables to predict visitation in Mount Rainier National Park (MORA). Collaborating with MORA officials, this project will delineate the park regions that have useful existing trail-count data, prioritizing those locations that are isolated and remote with only one access route. Social media posts that fall within these designated spatial zones will be combined with the other predictive factors like precipitation, institutional closures, and week-of-year to generate estimations regressed against on-site counts of hikers. If successful, this model could provide visitation estimates tied to my work quantifying human enteric waste in alpine waterways and offer other national parks and public lands methods to evaluate their backcountry use.