Project leads: Rachel Berney, PhD, assistant professor, Department of Urban Design and Planning and Gundula Proksch, associate professor, Department of Architecture
Data scientist leads: Bernease Herman (primary) and Amanda Tan (secondary)
DSSG fellows: Hillary Dawkins, Jacob Kovacs, Yahui Ma, Jacob Rich
Project Summary: In the past years, Seattle has seen unprecedented population growth, record construction activity, and an increase in housing cost, creating an affordability crisis for a large portion of the urban population. The “Equity Modeler” team is investigating the ongoing gentrification process and inequitable access to opportunities across many of Seattle’s neighborhoods. The project uses publicly available data for GIS-based mapping of equity indicators – related to housing and development, income, mobility, and education – on the city and neighborhood scale. It will develop a structural equation model to establish and predict relationships between indicators and analyze policies intended to initiate positive change.
The team’s goal is to create a tool that brings clarity and direction to an impassioned public discussion and allows stakeholders in the city’s development process to analyze, model, and visualize existing trends and the impact of potential changes in the built environment.
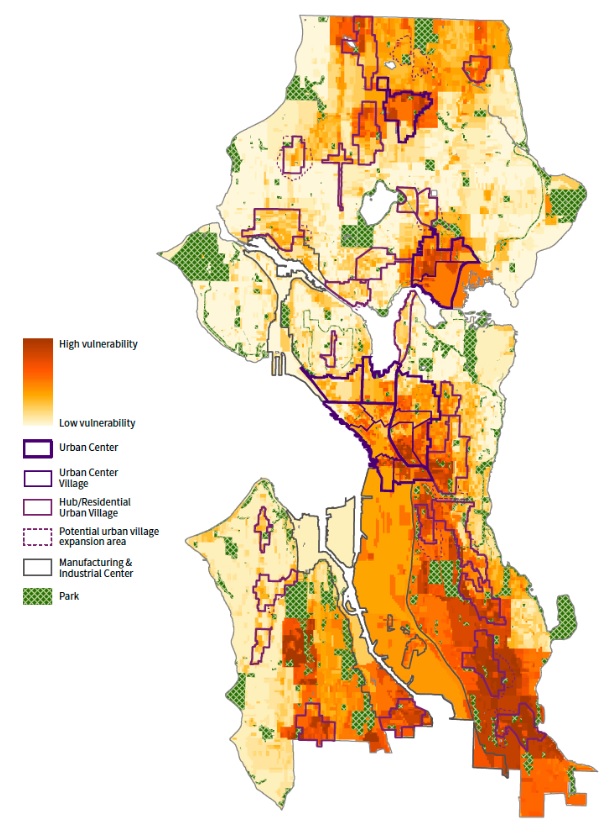
Project Outcomes: The team conducted a literature review and identified a set of indicators for each of several themes considered to be fundamental to the study of urban equity including housing, mobility, health, environment, socio-economic wellbeing, education, development, and neighborhoods. For each cluster of indicators the team conducted a factor analysis to determine the most crucial indicators. Those selected indicators were combined into a structural equation model, which allowed the team to evaluate correlation amongst the themes as well as to pilot a predictive function in the model that allows the viewer to toggle values higher and lower to test different development scenarios.
Using D3, the team developed a web-based interface for the modeler, that allows users to examine analytical layers at three different scales: Census block group, Census tract, and neighborhood as well as by individual indicator, thematic cluster, and by overall rating. The website also includes a prototype feature to zoom into the neighborhood and view data at the lot level.
View the article in GeekWire and blog posts.