Project Leads: Mark Hallenbeck & Anat Caspi – CEE (Civil & Environmental Engineering), Taskar Center
Data Scientist Leads: Bernease Herman (primary) and Anthony Arendt (secondary)
DSSG Fellows: Carolina Johnson, Victoria Sass, Yiqin Shen & Sean Wang
Project Goals: Seven regional transportation agencies use a common electronic fare payment system, called ORCA – One Regional Card for All. When ORCA was initially conceived and adopted (it has been in use since June 2009), the regional expectation was that one advantage of moving from simple visual card (A visual, paper monthly pass) to electronic media was that the resulting data would provide travel behavior information that could be used to improve regional transportation system planning and decision making. To date, that secondary purpose for ORCA data had not been routinely realized.
The UW has been granted access to nine weeks of ORCA data. That nine weeks of data corresponds to ~21,000,000 transit boardings, or roughly 15,500,000 transit trips – with ~5,500,000 transfers. These ORCA transaction records have already been linked to vehicle location data (AVL) to determine where those boardings took place. In addition, we have estimated for about half of those trips where the traveler exited the bus, and if they transferred, how long that transfer took place.
We – and the transit and planning agencies of the region – are interested in a variety of computer science activities, social science analyses, and transportation analyses. For the analyses within each of these fields we have to be extremely conscious of the privacy of individuals who ORCA cards, as well as the rights of the employers that often subsidize those cards.
For CS analyses, we were interested in better ways to process, store, and handle the very large data sets involved in these analyses. For example, to estimate boarding and alighting locations we have to search multi-gigabyte AVL files to find specific bus locations at specific times and dates, often without being able to process those look ups in a time sequenced fashion, and often switching between the AVL files for different transit agencies for one trip made by one individual.
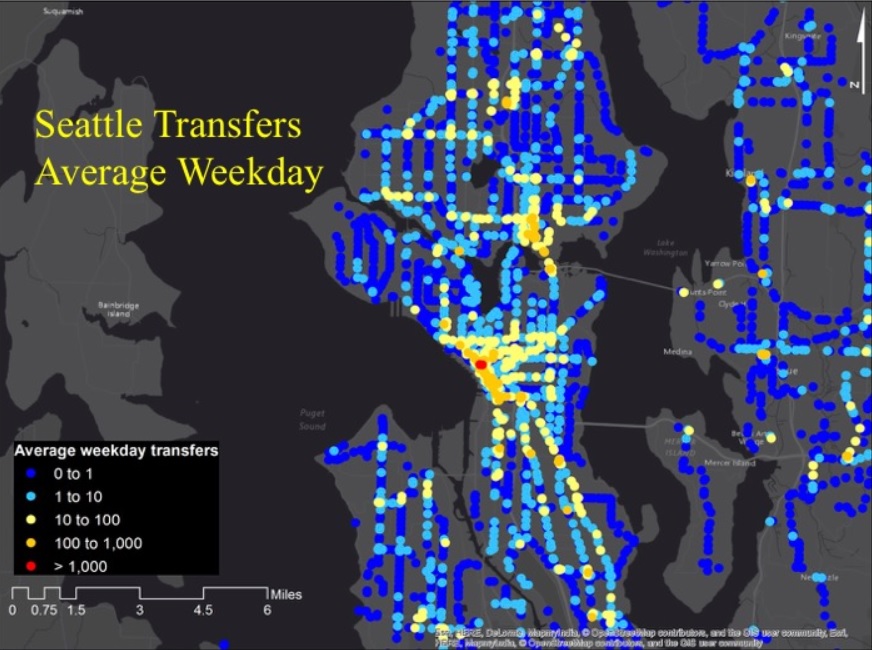
On the transportation side, we were interested in turning these data sets into decision support tools. We need better ways to store, visualize, summarize and query these data. For example, we would like to show graphically where large numbers of transfer take place, and then allow users to drill down into those locations to determine which routes transfer to which routes, how long it takes riders to transfer, and how far they walk to perform those transfers. Similarly, we have ~7,000,000 origin/ destination pairs (where people board and alight from transit vehicles). We needed ways to summarize and display where and when these trips take place.
On the social science side, we were interested in understanding when, where, and how often low income users take transit, and how those travel patterns differ from other users. We were interested in expanding our initial work that examines how employer transit subsidies effect transit use. The transit agencies are also interested in gaining a better understanding of the geographic connections being found in the data. Which portions of the region are interacting the most, and how efficient are the movements between those geographic zones? Does the transit system effectively serve all geographic areas? Are lower income groups being effectively served by transit?
Project outcomes: We started by identifying and characterizing biases and problems with the ORCA dataset. Since ORCA taps are not geo-located, we had use other sensor information to locate where people are boarding and make inferences about departure location based on future travel. Also, not all bus riders use ORCA. We determined the geographic bias for cash users in our dataset, which we can then associate with socio-demographic characteristics.
With a more complete understanding of the ORCA data, we conductive substantive analyses. This process was extremely challenging and involved complex database joins and unique journey id constructions that took the better part of the summer.
From these explorations one of the major projects we completed was the creation of a suite of applications in one integrated dashboard to shed light on the richness of these data and their potential for discovery. While each application by itself offers a deeper understanding of the data and powerful visualizations of its utility, we are really only scratching the surface of what can be done with this information. In essence this project really reaches beyond simply transportation or data science; at a larger scale, we are forming the foundation of what has been termed “smart city” approach to transit planning in the Puget Sound region.