Project Lead: Afra Mashhadi, Bell Labs, Nokia
Data Scientist Leads: Ariel Rokem (primary) and Jake VanderPlas (secondary)
DSSG Fellows: Rachael Dottle, Myeong Lee, Imam Subkhan & Carlos Espino
Project Goals: Household surveys and censuses, periodically conducted by National Statistical Institutes and the like, collect information describing the social and economic well being of a nation, as well as the relative prosperity of its different regions. Such data is then used by agencies and governments to identify those areas in most need of intervention, for example, in the form of policies and programs that aim to improve the plight of their citizens. Interventions can take many forms, from national or regional policy, to local regeneration projects. To provide the most value socio-economic data needs to be up to date and it ought to be possible to disaggregate the data at each of these levels of granularity, and in between. However, due to the high cost associated with the data collection process, many developing countries conduct such surveys very infrequently and include only a rather small sample of the population, thus failing to accurately capture the current socio-economic status of the country’s population.
Within the remit of ‘Data for Development’ there have been a number of promising recent works. One stream of research has focused on investigating the use of mobile phone Call Detail Records (CDRs) to estimate the spatial distribution of poverty or socio-economic status [1,2,3]. In another stream, researchers have relied on readily available data such as those of VGI to build models that could successfully predict the poverty level based on the offering advantages of the cities [4]. While both these research streams have successfully proposed models to estimate deprivation level, their results have thus far only been presented in isolation rather than in comparison. Furthermore, each face various shortcomings. For example the former source could provide information from a bigger sample however due to privacy laws and their commercial values, CDRs are often hard to get hold of. The latter stream does not suffer from this problem as it relies on the Open Data sources, however this information could be biased due to the lack of participations. That is one cannot distinguish whether the lack of amenities in an area of a city is due to poverty and lack of offering advantages or rather incompleteness of the Open Data.
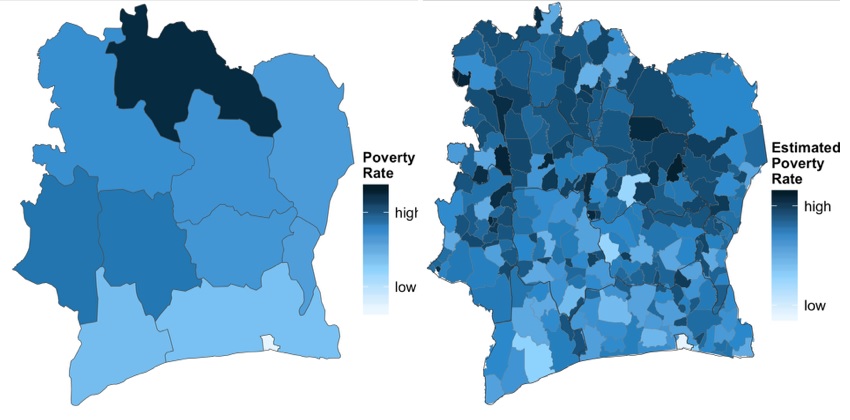
Project outcomes: In this project, we aimed to address what source of data is the best predictor of deprivation level in which situations? To this end, we leveraged a rich dataset [5] which included CDR data for two Italian cities. We merged this dataset with the city map data from Open Street Map, providing a basis for constructing models based on each dataset and the final heterogeneous model. To measure the accuracy of the proposed models we evaluated the deprivation prediction against census data available from The Italian National Institute for Statistics.
For both Milano and Mexico City, urban point of interest (POI) features were
extracted from OSM. These features were aggregated into categories. The results indicate that OSM amenities may prove to be useful predictors of deprivation in Milano. Additionally, CDR data can compliment OSM data in Milano. For Mexico City, OSM data predicts poverty well, especially street centrality measures.
To allow our stakeholders access to our model and data exploration, we built a dashboard that visualizes our extracted features, and allows users to explore our data layers. As of now, the dashboard is limited to visualization of our two case study cities, Milano and Mexico City. A future direction of our project would focus on improving the dashboard, so that users might upload data for any given city, and be able to extract predicted deprivation values, as well as other features such as street network centrality. The results of this project may be applied to further research into means to estimate the spatial distribution of poverty from big data, such as social media data, infrastructure-sensed data and crowd-sourced data.
Visit the archived GitHub repository for this project.
References
[1] Smith, Christopher, Afra Mashhadi, and Licia Capra. “Ubiquitous sensing for mapping poverty in developing countries.” Paper submitted to the Orange D4D Challenge (2013).
[2] Smith-Clarke, Christopher, Afra Mashhadi, and Licia Capra. “Poverty on the cheap: estimating poverty maps using aggregated mobile communication networks.” Proceedings of the SIGCHI Conference on Human Factors in Computing Systems. ACM, 2014.
[3] Frias-Martinez, V., and Virseda, J. On the relationship between socio-economic factors and cell phone usage. In Fifth International Conference on Information and Communication Technologies and Development (ICTD ’12), ACM Press (New York, New York, USA, Mar. 2012).
[4] Venerandi, Alessandro, et al. “Measuring urban deprivation from user generated content.” Proceedings of the 18th ACM Conference on Computer Supported Cooperative Work & Social Computing. ACM, 2015.
[5] G. Barlacchi, M. De Nadai, R. Larcher, A. Casella, C. Chitic, G. Torrisi, F. Antonelli, A. Vespignani, A. Pentland, and B. Lepri. A multi-source dataset of urban life in the city of Milan and the Province of Trentino. Scientific data, 2015