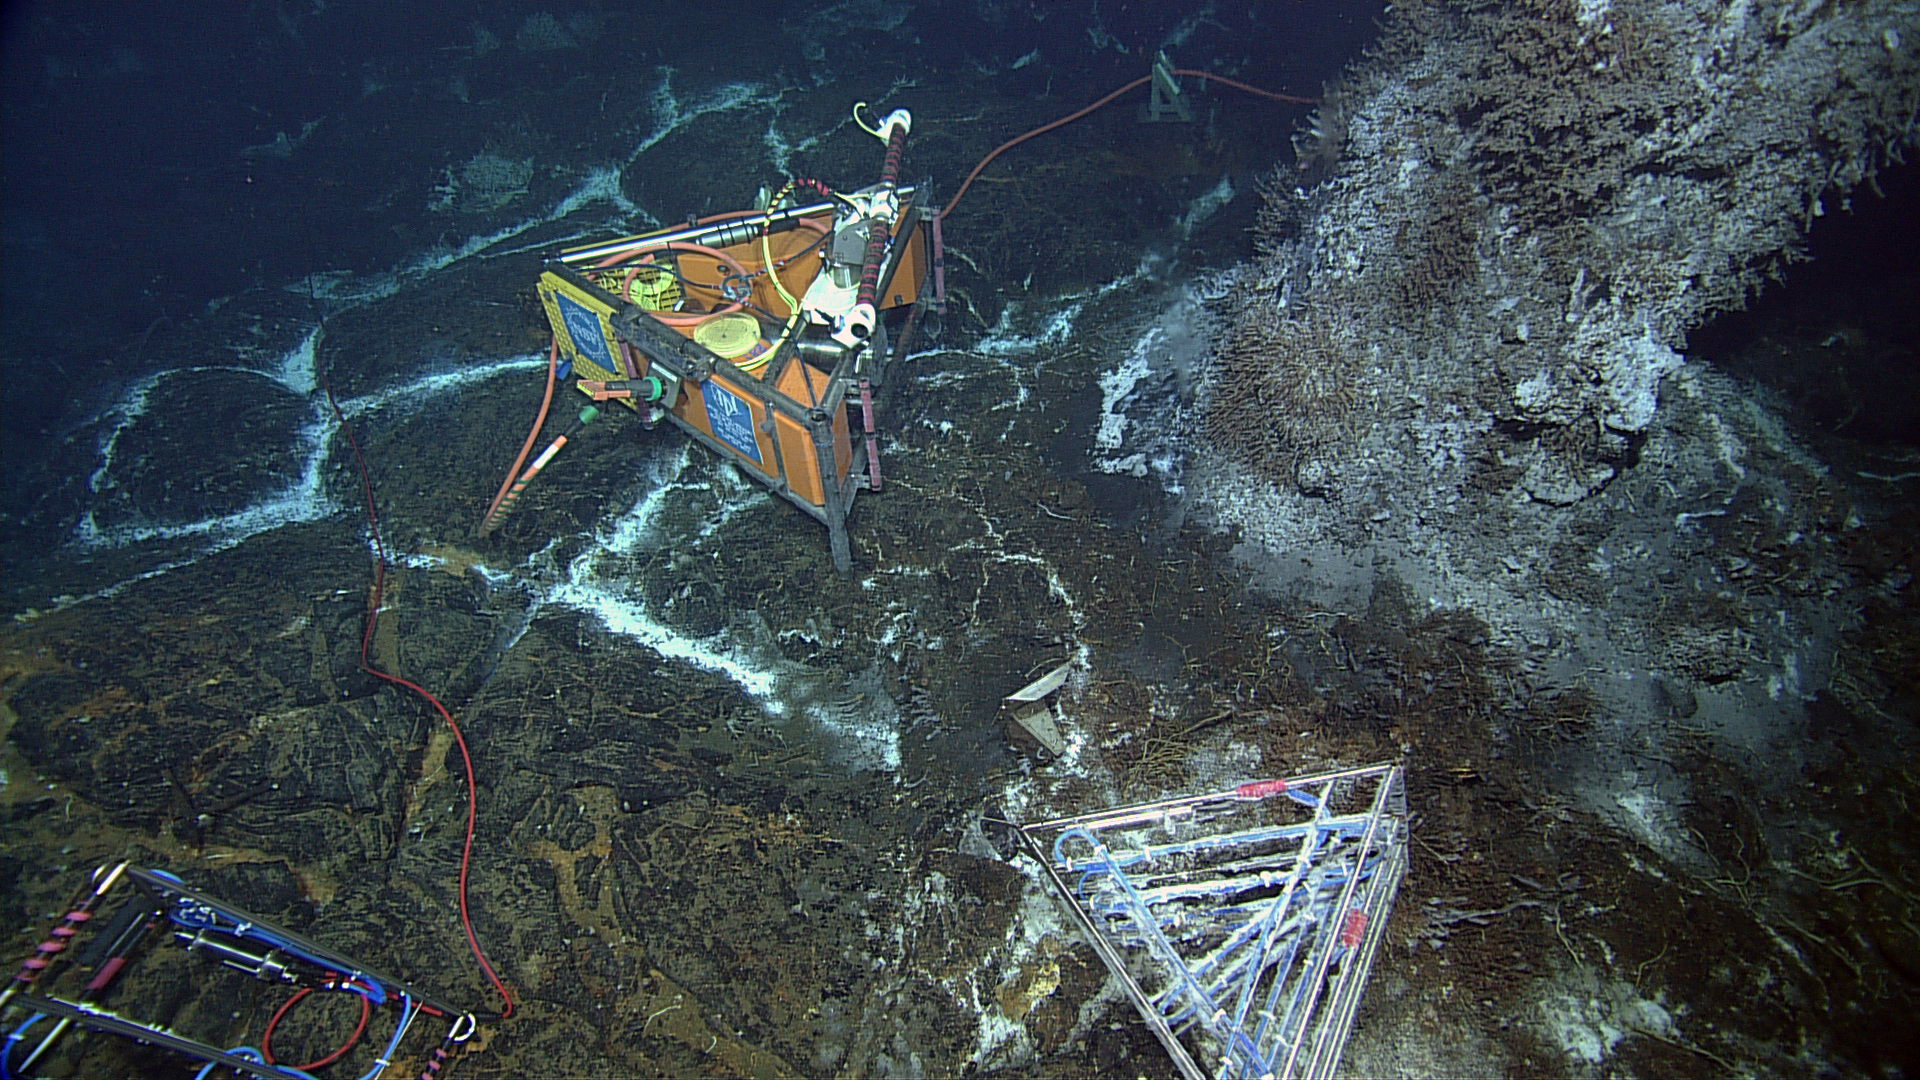
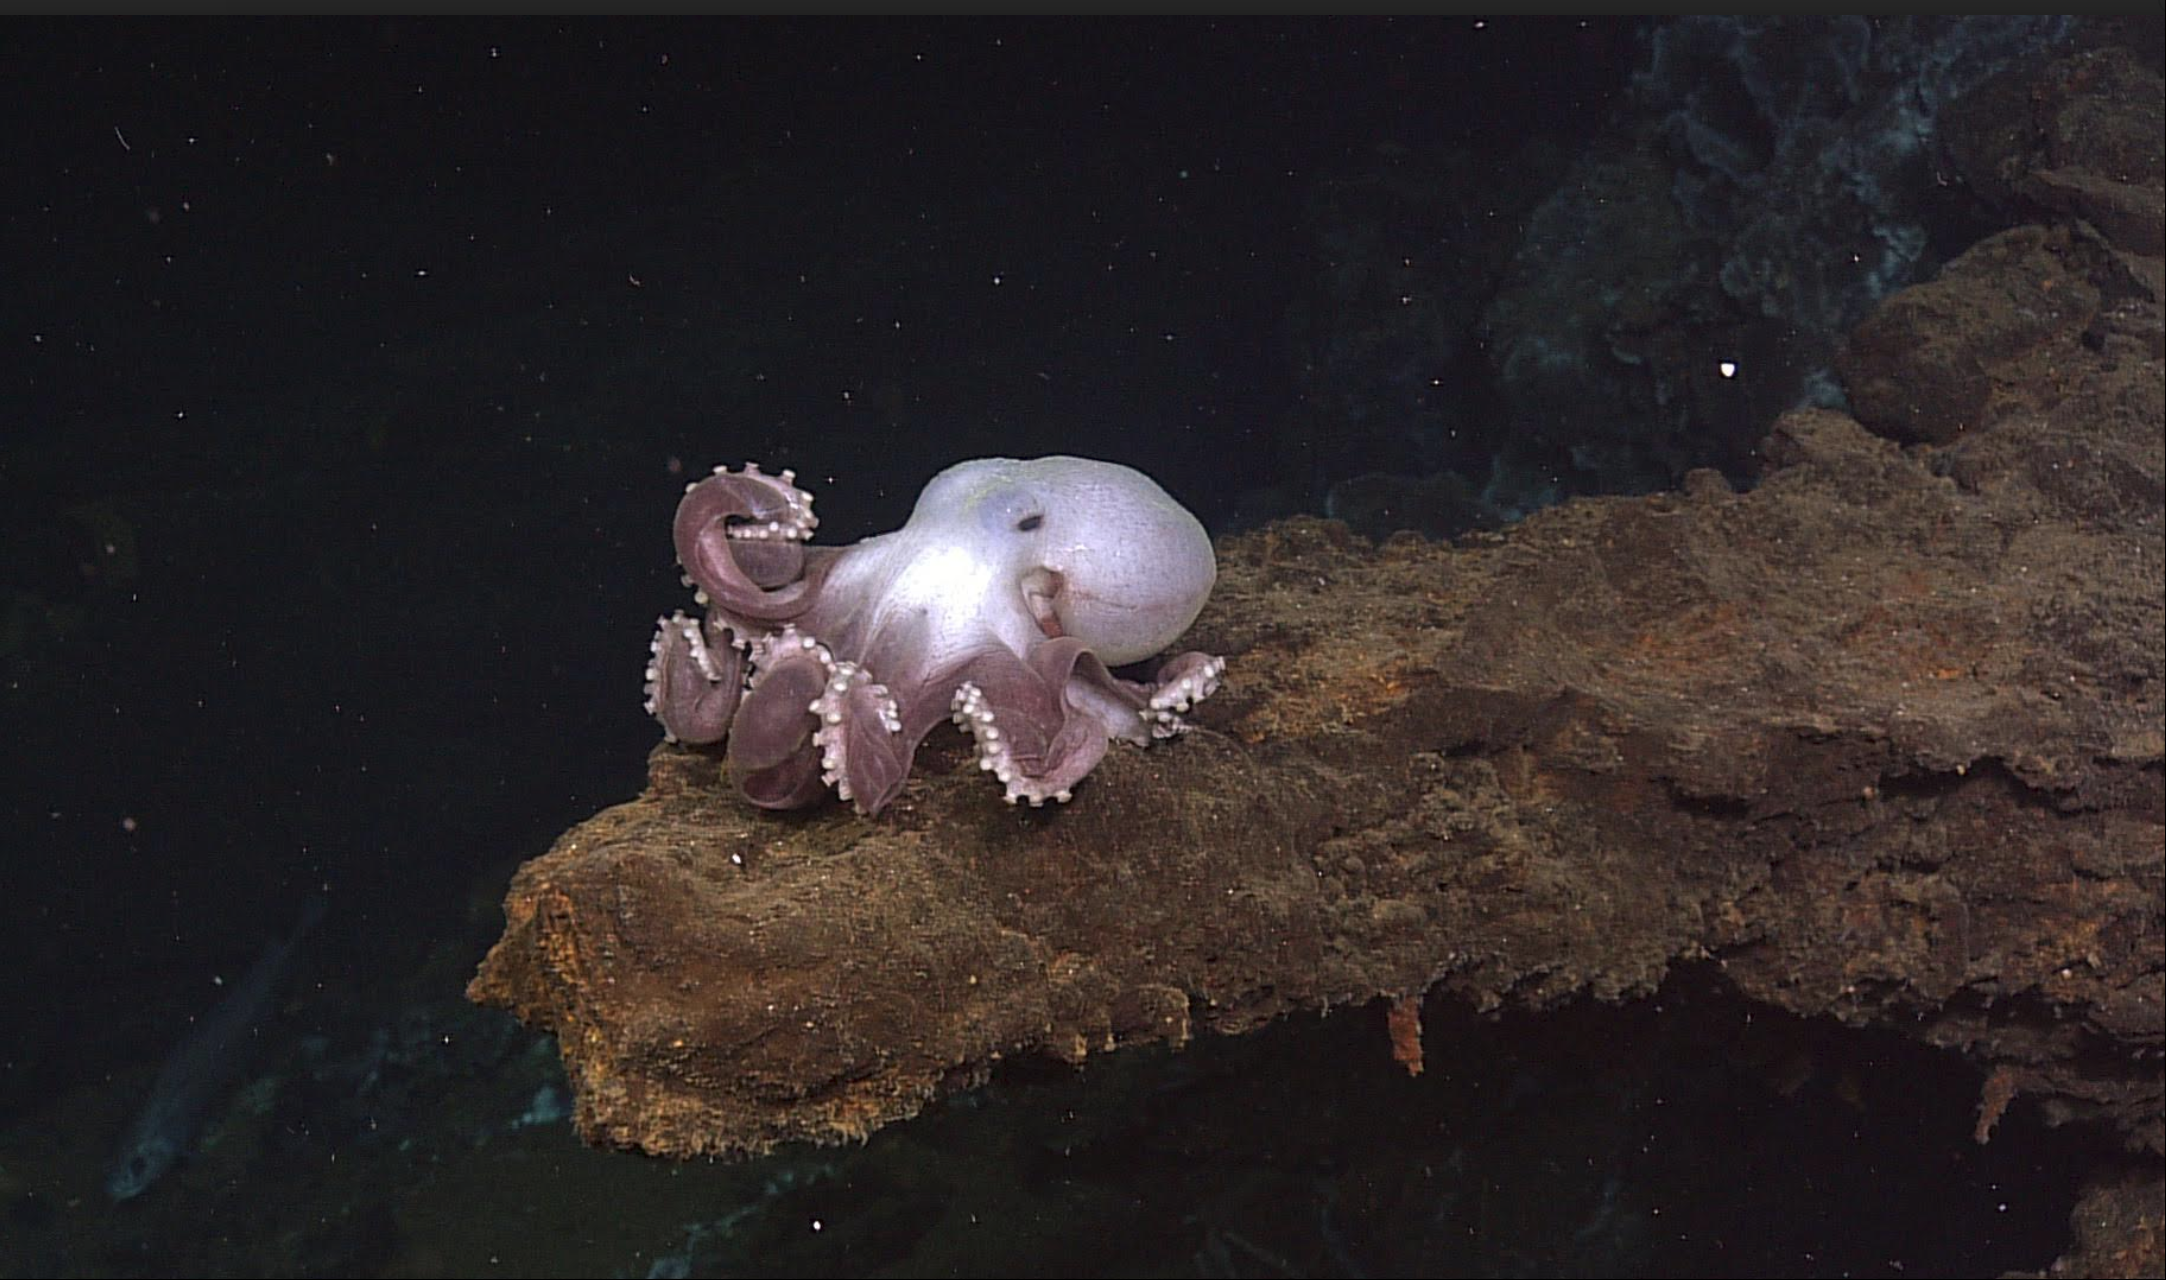
Photo credit: NSF-OOI/UW/CSSF; Dive R1730; V14
By Rob Fatland, UW Director of Cloud and Data Solutions
Have you ever wondered why volcanic eruptions on the ocean floor don’t boil the ocean? Me, too. Of course, the ocean ought to win being much larger than the volcano. But stay! Surely a volcano would boil at least a little bit of the ocean. And what would it look like, rivers of lava pouring out of the sea floor? “What we need…” I found myself thinking, “…is a nice camera on a robot fish to swim about filming these volcanoes erupting.”
Happily John Delaney and Deborah Kelley are decades ahead of me: together with brilliant people at the UW Applied Physics Lab (APL) and the UW School of Oceanography (and many others beyond) they have built an observatory into the ocean floor right on top of a volcano that erupts every eight or nine years or so with lava flows two-thirds the height of the Space Needle. This observatory is called the Regional Cabled Array (RCA) and I’m going to take a moment to describe it.
But first, why am I writing this article? Well, a common challenge in Earth science is that the scientists are so good at building sensors and observatories that they overwhelm themselves with their own data. This is the “data deluge problem”; and if drinking from a fire hose sounds difficult, imagine drinking even a modestly small corner of a literal ocean of data. The scientists therefore need help getting the computing power lined up to cope, and I work on applying the computing power of the public cloud to research computing, so I got the call. “Can your group help us build some data deluge machinery?” After checking with my team I said, “We’d love to!” and thus we instantly became assistant oceanographers, on loan from the eScience Institute and UW Information Technology to the UW School of Oceanography.
Now once we got involved with oceanography, with this enormous observatory, what are we contributing? Let’s begin with a different question: what is the desired result? Suppose that somewhere in all of the recorded whale calls (see below) there is a humpback song in a particular humpback dialect. Perhaps this same whale is recorded singing off the coast of Maui a month later. That tells us a lot about this whale and his associates. And what if, in all of the recorded seismic data we catch a pre-eruption pattern that matches a pattern from 2015, perhaps indicating a release of gas-rich water from the subsurface that triggers the eruption? Finally, can we “see” large underwater waves that travel beneath the ocean’s surface and by seeing them figure out if they impact organisms living in the oceans?
It would be a pity to miss out on discovering these things, particularly as we are absolutely certain they are there in our records. We don’t know in advance what they are, but we are certain as scientists can be that amazing stuff is in there. So my team got involved to help put into place the data analysis tools to go from ‘amazing science is in there’ (in the archives) to ‘Aha! This is SO COOL!’ It is not enough to store the data. Scientists have to have the tools to efficiently look at the data from all angles, from every point of view they can imagine, to ask a million questions and start pulling the thousand ‘Aha!’s’ out of the data archive. We don’t want to drink or boil the ocean; we just want the to tools to understand it better.
What does an observatory in the ocean record? Observations must be tagged with water depth plus latitude and longitude; the first thing we need as observers is where we are and what time it is. For this we need some sort of sturdy robot holding a durable sensor because we get down to a depth of 3000 meters at the sea floor (two miles); which is 300 times atmospheric pressure.
So okay, with our tough robots and sensors let’s measure life. At night on the ocean surface we find lots and lots of very small animals (‘zooplankton’) happily snacking on small algae (‘phytoplankton’) and on one another. Measure again in daylight and most of the zooplankton have decreased dramatically. Phytoplankton are still there making sugar from carbon dioxide, water and sunlight, but where are the zooplankton? Neither north nor east; they avoid the daylight by swimming down, down into the darkness of the deeps. As an aside: during the last solar eclipse on Aug. 21, 2017, these zooplankton became confused when night fell at 11 in the morning. They dutifully started swimming back up towards the surface … but then the solar eclipse ended, they yelled out “Yikes!”and turned around to swim back down into the dark. How do we know? The observatory captured their confusion as data using a plankton sonar.
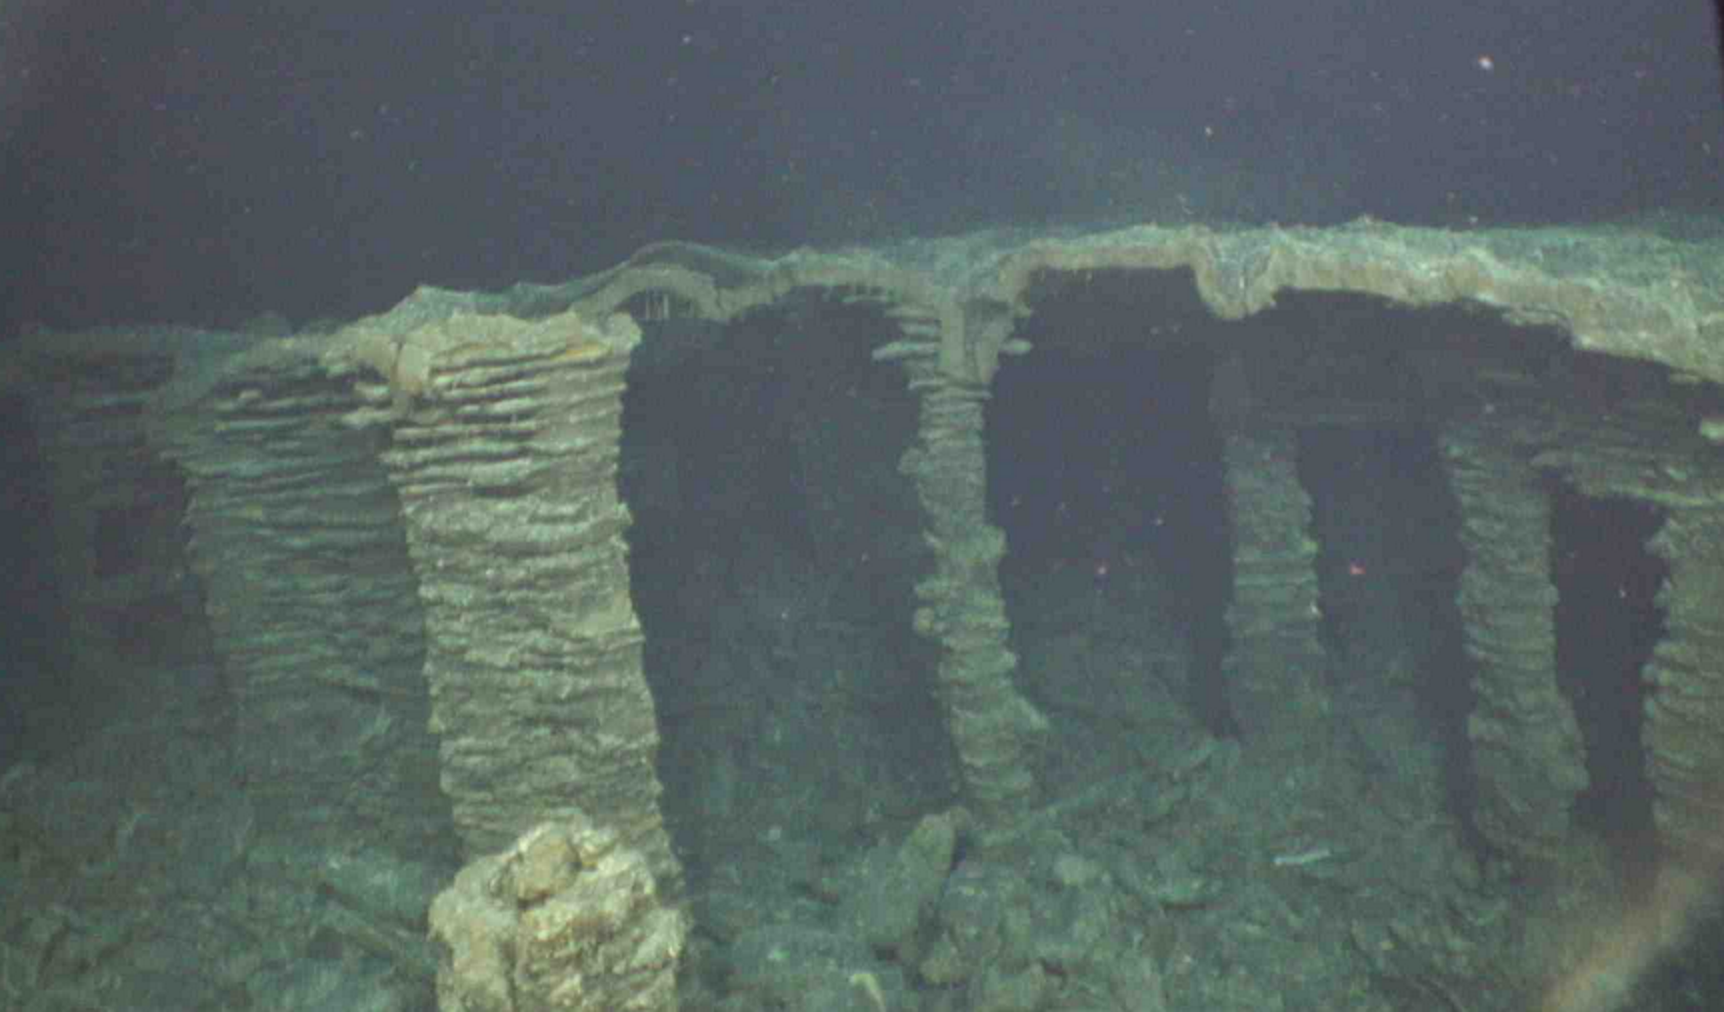
What else can we measure? The volcano (called Axial Seamount) produces earthquakes that increase in frequency and intensity as the eruption becomes imminent – during an eruption there are thousands of earthquakes in a single day as the eruption initiates. We’ll measure those as well as the tilt of the ground as it gradually inflates upwards. As we visit the sea floor to install the observatory we find strange artifacts of previous eruptions. Our robots show us strange artifacts from past eruptions:
Moving on from volcanoes to ocean chemistry, one of the central ideas is understanding carbon. The ocean is Earth’s largest reservoir of mobile carbon, acting as a buffer that absorbs excess atmospheric carbon dioxide. Though to be clear, the ocean can’t keep up with increasing atmospheric carbon so it is only a partial buffer. Beyond measuring carbon chemistry and nitrates (nutrients) of course, we can track temperature and how salty the ocean is with depth.
As the observatory records these data from the ocean floor to the sea surface many times per day, it is soon clear that we are measuring the pulse of a gigantic living system. Meanwhile down on the seafloor there are high-resolution video cameras watching underwater hydrothermal vents that spew out sulfur-rich super-heated water (350 degrees Celsius!) You can watch live footage of the Axial Seamount volcano every three hours four times a day.
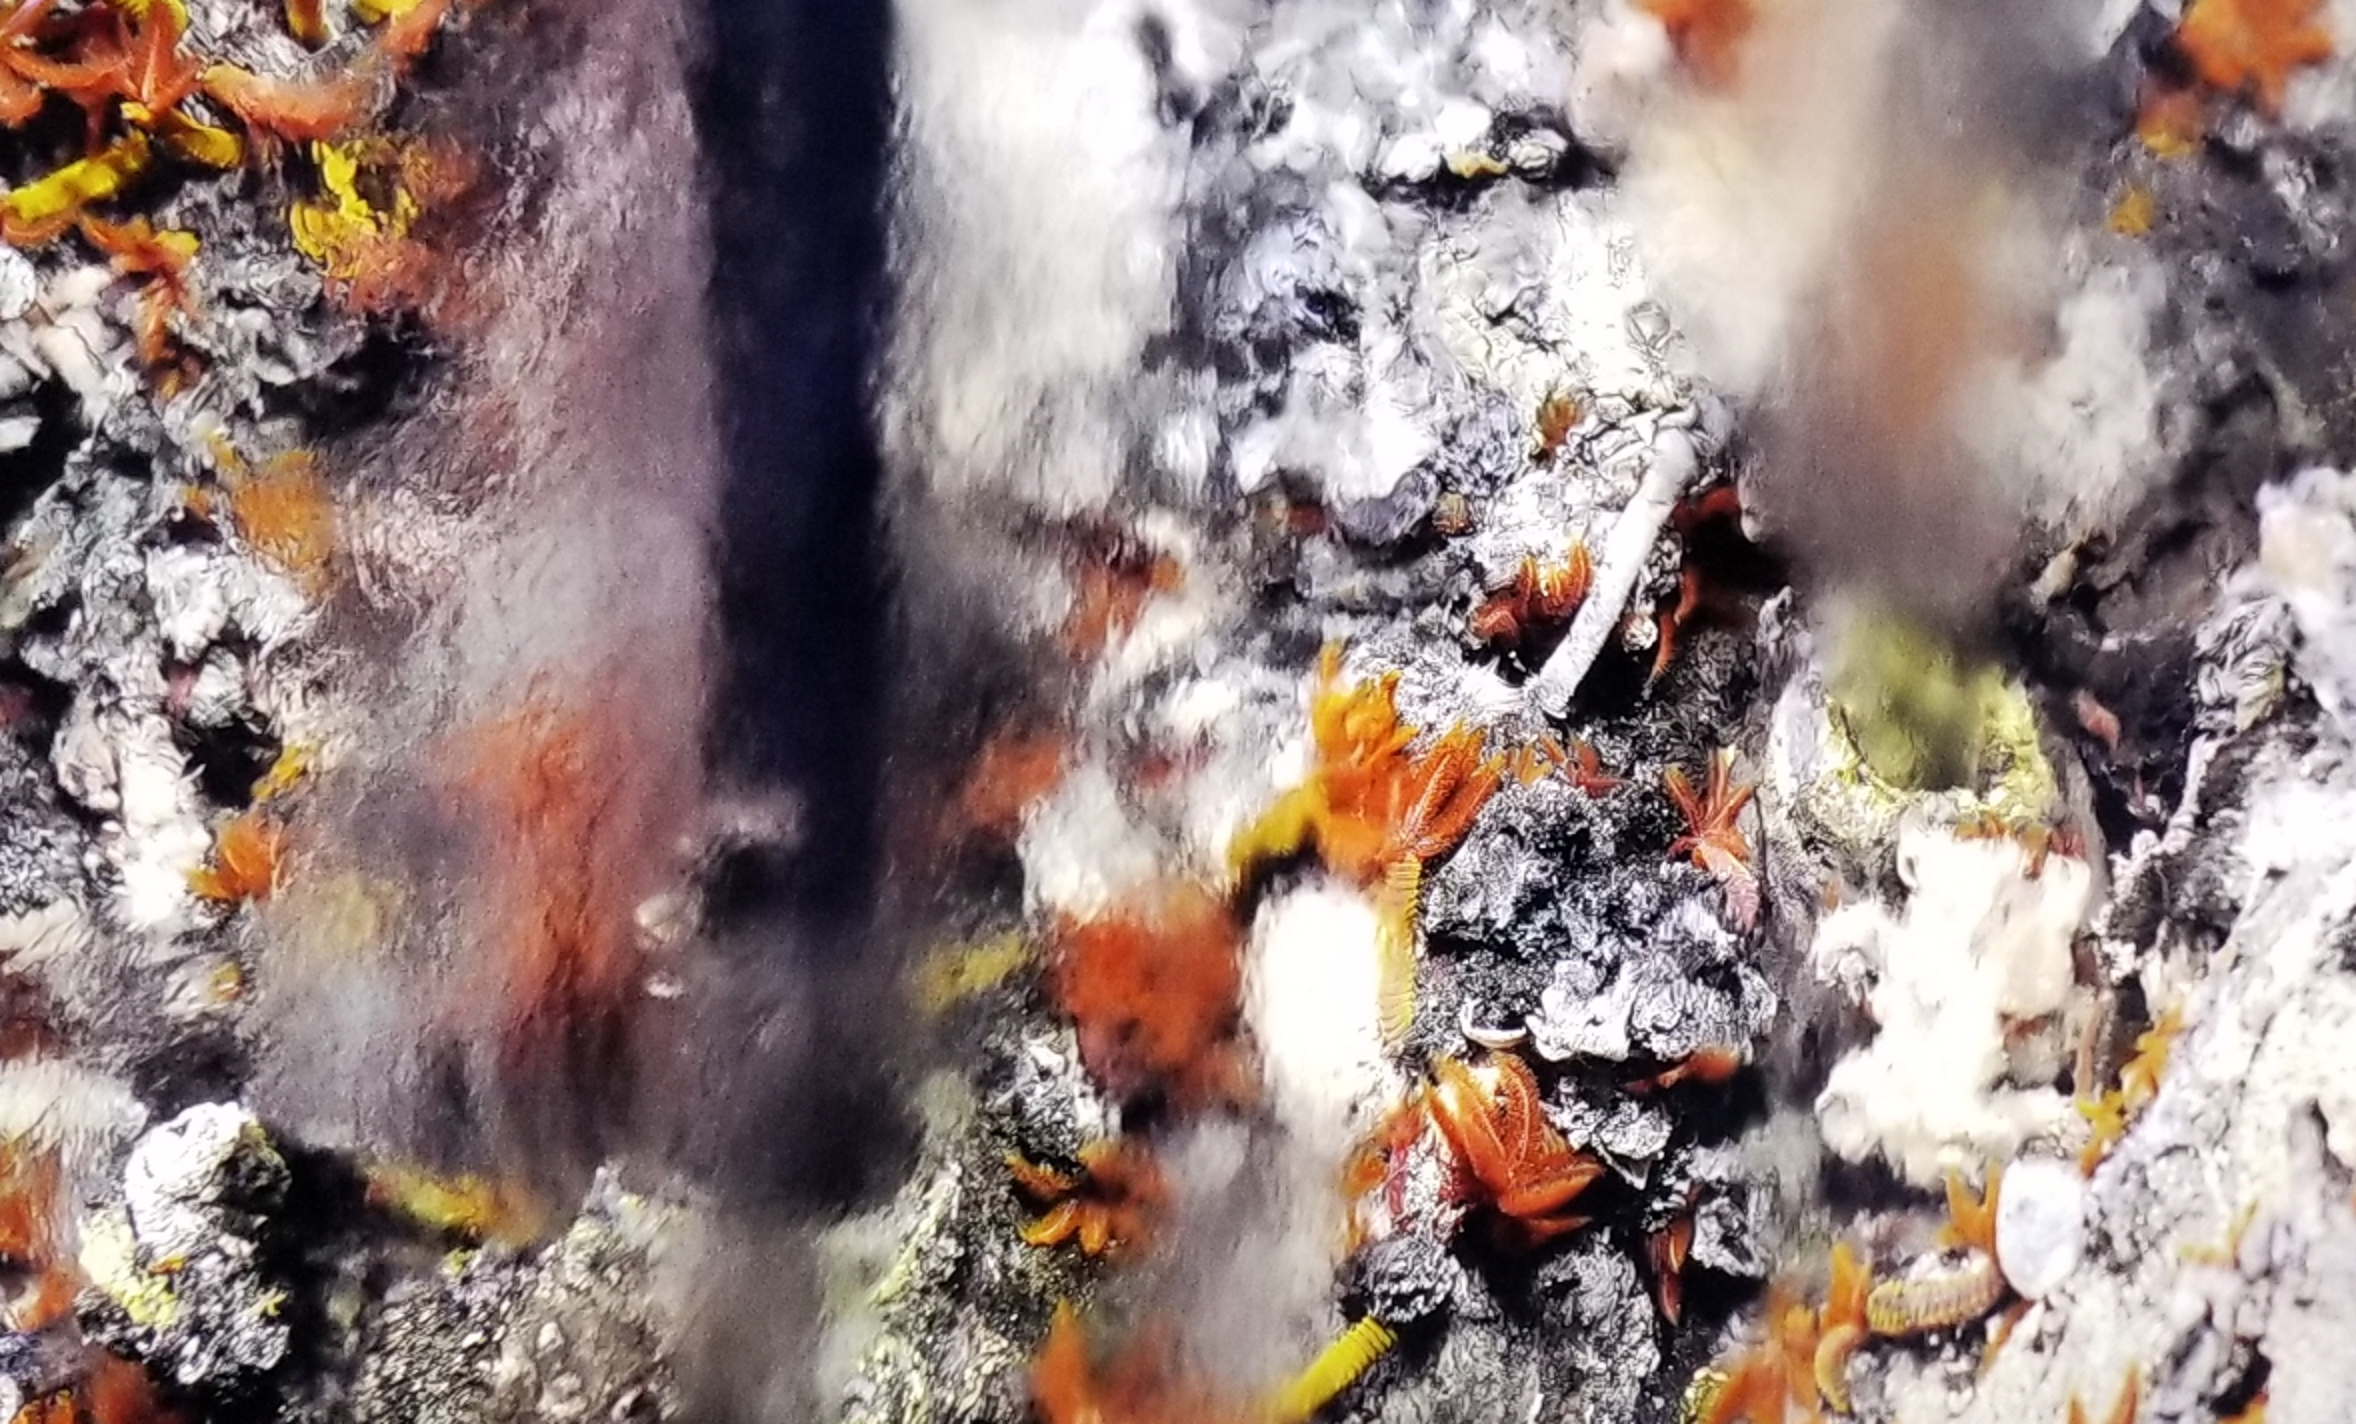
…whereby vast agglomerations of tube worms thrive on volcanic gases…
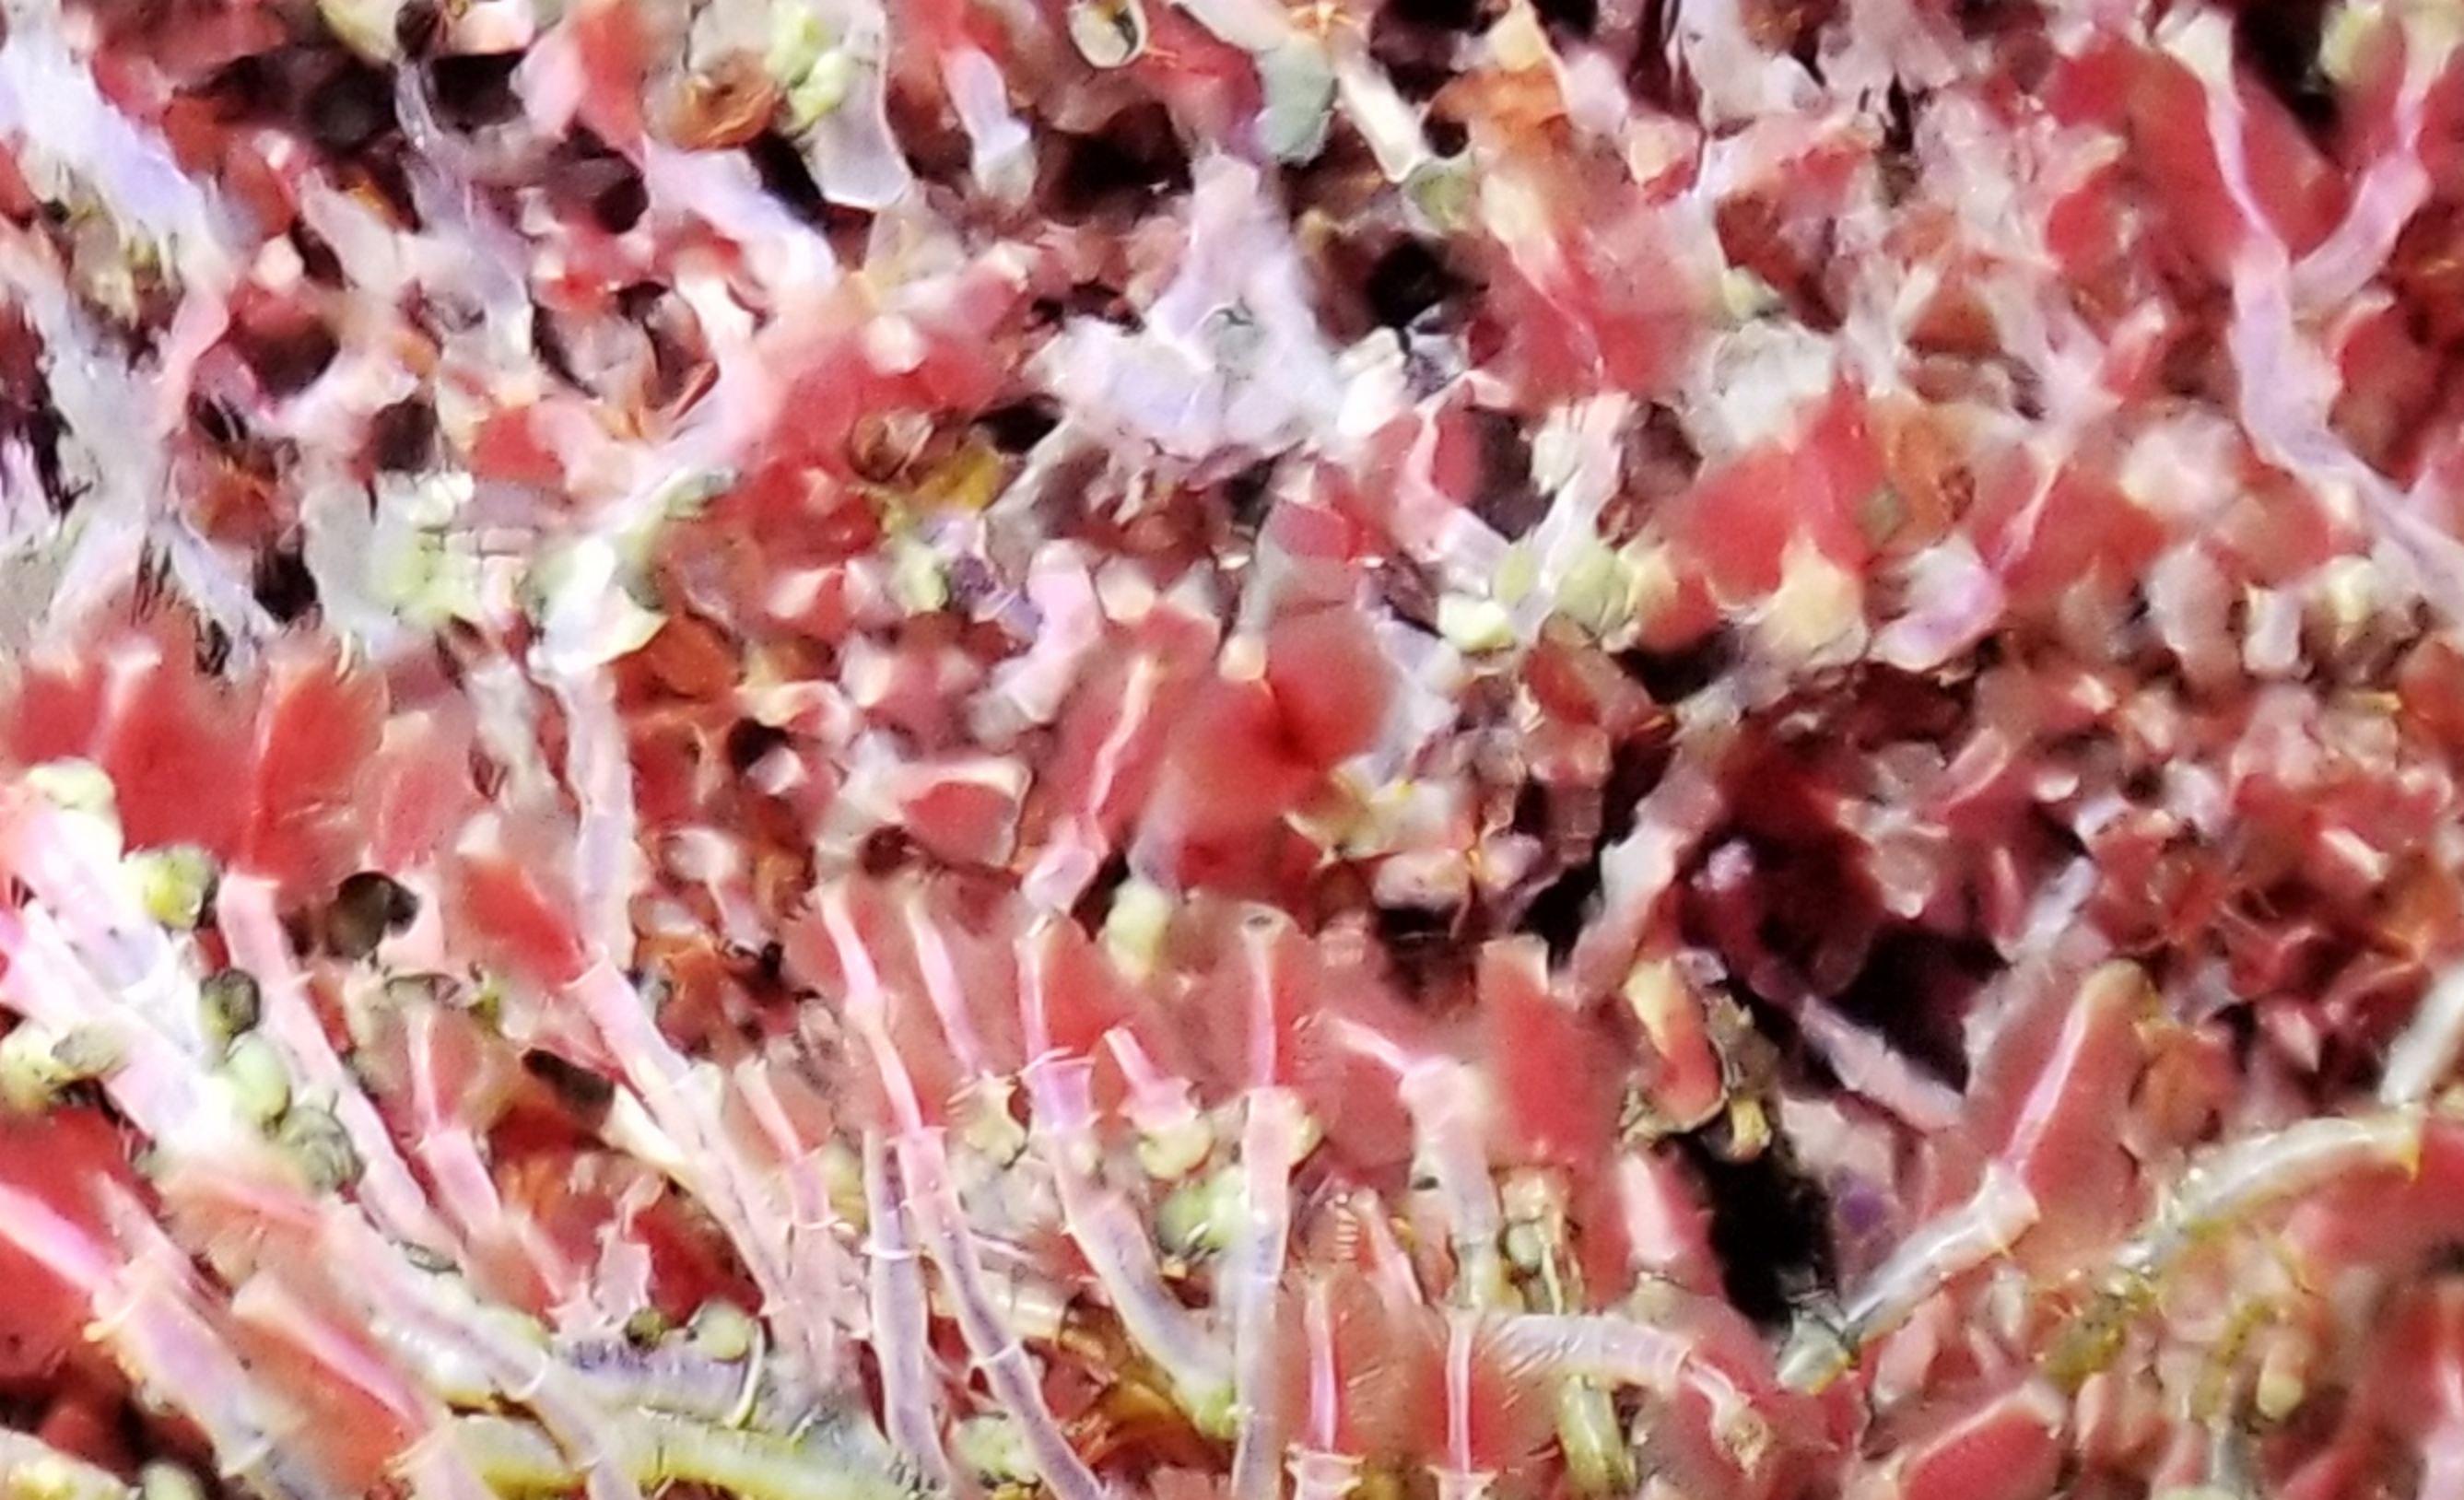
And so on up the food web to larger creatures (this octopus is living at a depth of 1500 m)…
…until we reach some very large creatures indeed…
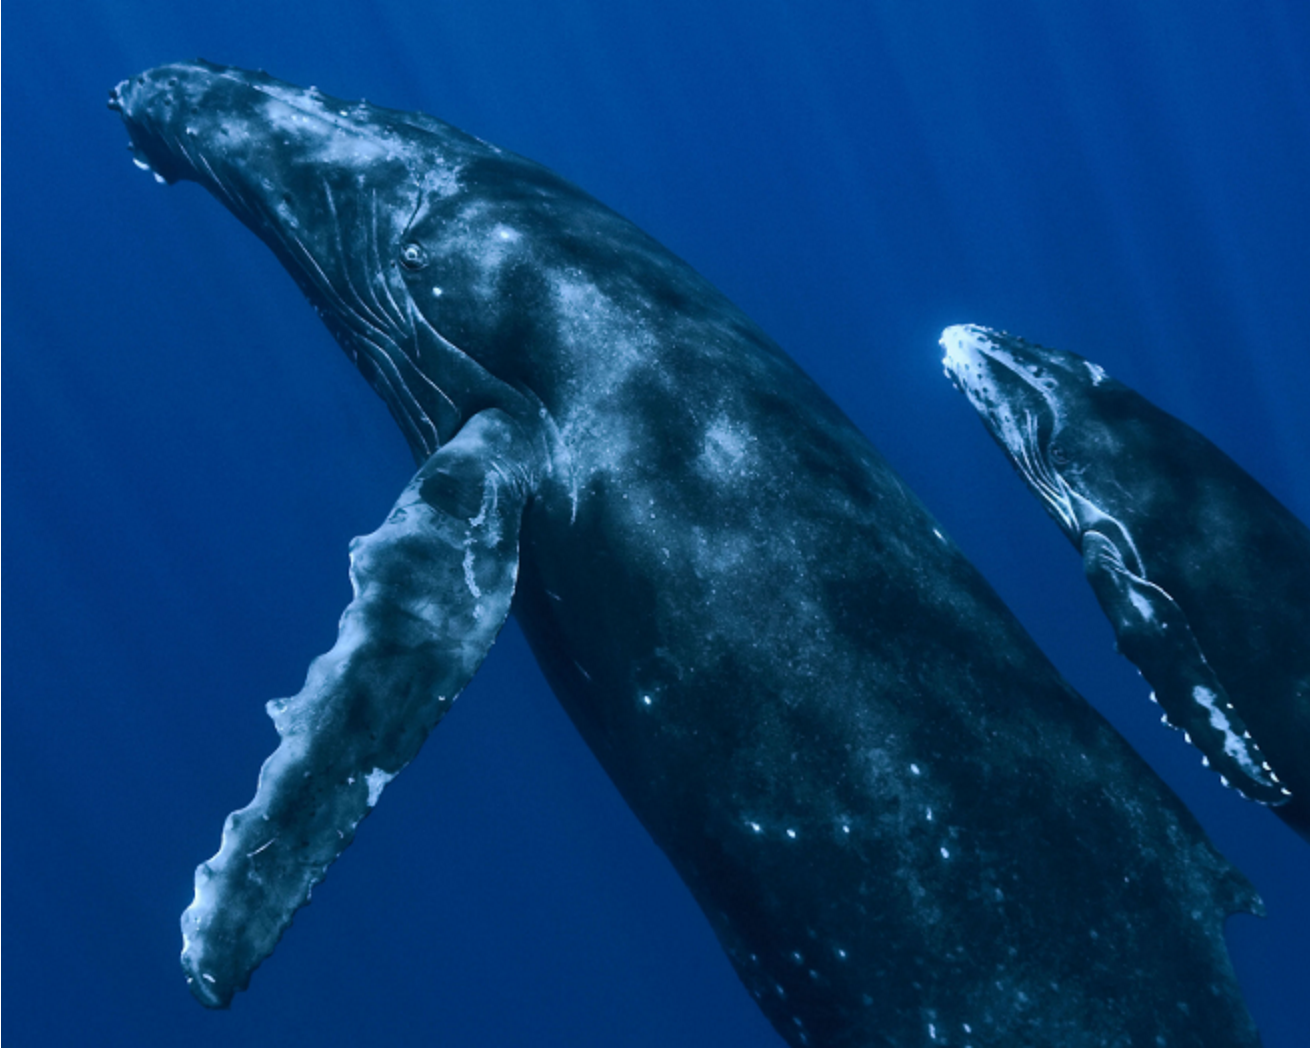
…who have a great deal to say. In fact, here is five seconds of what the RCA observatory recorded (it listens to the ocean as well) on Oct. 6, 2017:
Five second recording of a humpback whale recorded by the RCA.
Team member Dana Manalang has made a great stride forward in telling the story of the RCA; she has just published a children’s book called ROPOS and the Underwater Volcano about a robot named Ropos who works tirelessly building the observatory at Axial Seamount. Ropos has been hard at it for the past five years and thus became the star of the book. But Ropos works from a large research ship, so what about those autonomous robot fishes I mentioned above with cameras filming the next eruption? The answer is that they are planned, but not built yet.
The observatory is out there providing power and data feeds, and the science community is hurrying to build robots that will take advantage of observatory docking space, so now you see it is a race against time. Can we get those robots in place before Axial Seamount erupts some time in 2021? Place your bets and watch this space.
Meanwhile we will keep working to make the data and information we touched upon in this article open and available to scientists, teachers and the public. We feel that pictures and sounds and stories – data-driven stories – from the ocean make it feel more like our backyard, a place that we know and care about.
Here are some of the many people working on this project:
- Don Setiawan, School of Oceanography, Lead Software Developer; eScience Affiliate Research Technician
- Dwina Solihin, School of Oceanography, Lead Front End Developer
- Wu-Jung Lee, Applied Physics Laboratory, Project Manager
- Purshottam Shivraj, Masters Student, UW Computer Science and Engineering; Test Software Developer, UW IT Data Scientist; eScience Institute Student Cloud Research Specialist
- Amanda Tan, PhD, UW IT Associate Director of Research Computing; eScience Research Staff; RCA Consultant
- Deborah Kelley, University of Washington School of Oceanography Faculty; Director for the Regional Cabled Observatory
- John Delaney, School of Oceanography, Program Director and Principal Investigator for the Regional Cabled Observatory
- Dana Manalang, Applied Physics Laboratory, Instrument Engineer for the Regional Cabled Observatory
- Rob Fatland, UW IT Director of Research Computing; eScience Executive Committee Member