
By: Louisa Gaylord
The eScience’s annual Data Science Incubator program kicked off last week, which enables new research discoveries by bringing together data scientists and domain scientists to work on focused, intensive, collaborative projects. Our team of data scientists provide expertise in state-of-the-art technology and methods in large-scale data manipulation and analytics, cloud and cluster computing, statistics and machine learning, and visualization to help researchers extract knowledge from large, complex, and noisy datasets. In the eight years since the Incubator program launched, eScience has collaborated on 57 total projects from a hugely diverse range of UW departments and units.
This year, we selected five projects to further explore data science as it applies to the areas of offshore earthquakes, phytoplankton, urban green spaces, spectral topography, and Covid-19 disinformation.
“Machine-learning-based detection of offshore earthquakes”
Project Lead: Zoe Krauss, School of Oceanography, College of the Environment
Data Science Lead: Scott Henderson
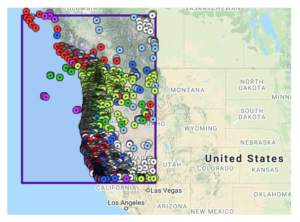
The fault zones that cause the most devastating earthquakes and tsunamis on Earth lie beneath our oceans, but offshore seismic observations are severely limited by a lack of instrumentation and noisy data. To fully understand Earth’s geodynamics and the hazard that offshore fault zones present, we need to overcome these limitations to produce offshore earthquake catalogs that capture as small of signals as possible. In our eScience incubator project, we will leverage newly available offshore seismic datasets to improve offshore catalogs using machine learning techniques. We will work to develop a cloud-based workflow that processes offshore seismic data into an earthquake catalog in near-real time, providing a strong foundation for future offshore earthquake monitoring and scientific study.
“User-friendly Tools for Oceanic Plankton Image Analysis (UTOPIA)”
Project Lead: Ali Chase, Washington Research Foundation Postdoctoral Fellow, Applied Physics Laboratory
Data Science Lead: Valentina Staneva
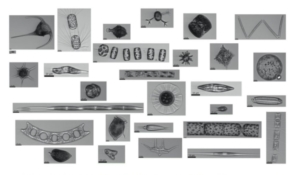
Thanks to recent advances in instrumentation, we can now observe phytoplankton – the single-celled autotrophs that form the base of the marine food web – using automated, high-throughput microscopy. Millions of phytoplankton images have been collected from oceans and seas across the globe, using an instrument called the Imaging FlowCytobot (IFCB), which is deployed onboard oceanographic research vessels and captures thousands of individual particle images every hour. Use of novel plankton imagery data to address a wide range of oceanographic and marine ecosystem questions is currently limited by the time required to analyze and categorize images. Processing these images for use in oceanographic research is time consuming, and the quantity of data necessitates the use of automated processes to classify images. Thus, the need for open-source, efficient, and effective classification tools is high. The primary objective of the UTOPIA incubator project is to develop machine learning methods for IFCB image data classification, and to produce an open-source, user-friendly tool that allows for broad application within the oceanographic research community.
“Climate Refuge in Urban Areas: Using Spatial Data to Identify Risk and Benefit Tradeoffs”
Project Lead: Rebecca Neumann, Civil & Environmental Engineering
 Data Science Leads: Spencer Wood and Scott Henderson
In Washington state, climate change is causing more frequent summer water shortages, wildfire, flooding, poor air quality, heat-related illnesses, respiratory illnesses, and mental health stress. Socially and economically disadvantaged people are disproportionately impacted by these changes. Given these disproportionate impacts, there is a need for regional managers and planners to understand and prepare for the changes that will occur within different neighborhoods. In urban areas, greenspaces and blue spaces (i.e., water bodies) are important features, providing refuge against hot temperatures and even helping to mitigate heat island effects. However, many areas in the Puget Sound region are impacted by legacy contamination (e.g., emissions from the former Asarco Smelter), air pollution, and water pollution. It is important that efforts to create new outdoor climate-refuge space consider the potentially negative health effects associated with exposure to pollution and contaminants given increased use of these impacted areas. In addition, some existing green and blue urban spaces are presently contaminated, resulting in certain activities, like fishing for food, posing a health risk. In this project we are creating a Python workflow that can assist with generating the knowledge managers need to evaluate benefits and risks associated with existing and planned spaces for climate adaptation. We intend to create python scripts that will ingest relevant spatial data about existing green and blue spaces, air temperature, air pollution, and soil and water quality; clean and align those data; calculate key metrics for spatial locations (e.g., areas with high environmental exposures); use metrics along with existing environmental health research to create trade off curves for gridded locations; and create maps and other visualizations for results. Ultimately, after community and agency input, the tool will provide information needed for city manager and planner to identify areas in need of new green and blue spaces, understand the environmental risk involved with creation of these spaces, and to determine if existing green and blue spaces require investment for lowering environmental exposures to pollution.
“Geometry of Color: Connecting spectral topography of the central cone photoreceptor mosaic to functional limits of the human trichromatic visual system”
Project Lead: Sierra Schleufer, Neuroscience
Data Science Lead: Bryna Hazelton
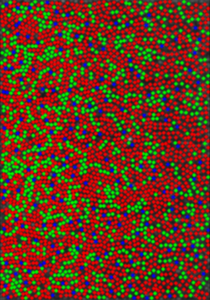
Humans experience remarkable visual acuity among mammals thanks to a retinal mosaic in which cone photoreceptors sensitive to three spans of the visual spectrum are increasingly concentrated toward the central visual field. Our trichromatic vision allows us to discriminate hues along two spectrally opponent axes in addition to luminance thanks to an interleaved mosaic of L, M, and S cone photoreceptors sensitive to long-, middle-, and short-wavelength spans of the visual spectrum, respectively. Resolution and detection along these three axes are fundamentally limited by cone spatial and spectral topography, i.e. the ratio, density and arrangement of the 3 cones types in the photoreceptor mosaic. In some respects these arrangements are known to vary widely between people, e.g. the global ratio of L to M cones, with surprisingly little-to-no effect on standard color vision metrics. Other features are thought to be more consistent, e.g. percent S cones as a function of retinal eccentricity.
Our team will explore extant analyses that are best suited to evaluate how cone arrangement influences and constrains spatial and color vision with respect to resolution, detection (signal-to-noise), spatial and chromatic aliasing, spatiotemporal factors imposed by fixational eye movements and cone photocurrents, and the differentiability of luminance and spectral contrast from downstream retinal ganglion cell responses. We will apply these analyses to LMS-classified cone mosaics spanning the central ~5° radius of the retina in 4 human subjects 1) characterize how L, M, and S cones are arranged with respect to each other, and 2) quantify variation of spectral topography as a function of eccentricity within and between individuals. This project will contribute to basic vision science the most detailed characterization of human spectral topography to date and bring innovative analyses from other fields to retinal physiology. Findings thereof will provide the basis for studying structure-to-function hypotheses to be tested in the future with biophysical models and human psychophysics.
“Patterns of COVID-19-related disinformation on Twitter: key findings and epistemological and methodological insights”
Project Lead: Katie Gonser, Jackson School of International Studies
Data Science Leads: Jose Hernandez
This project looks at COVID-19-related disinformation in Louisiana and Washington state during the first two surges of the pandemic. Part of a broader collaborative study between social scientists at the University of Washington and computer scientists at Louisiana State University, this research focuses on Twitter users’ sentiment and language use to make multi-way comparisons across and between the two states, at different stages of the pandemic, between COVID- and non-COVID-related content, and across users’ age and gender. For the eScience Incubator Program, we are working on building a dashboard of data visualisations that all members of the project can use to more readily view our comparisons and help with initial data exploration. Due to the interdisciplinary nature of our team, another main goal is to facilitate collaboration between project members by improving our understanding of machine learning tools and concepts.