By: Louisa Gaylord
Stuart Ian Graham is a graduate student in the University of Washington’s Biology program who recently published a paper with Senior Data Science Fellow and eScience Institute Research Scientist Ariel Rokem, along with others from the University of Washington, Université de Montpellier, and University of California Los Angeles. The paper, published in the Forests journal and titled “Regularized Regression: A New Tool for Investigating and Predicting Tree Growth,” initially grew from a 2019 Winter Incubator project at eScience, which paired Graham and Rokem together to utilize data science to explore how neighboring tree species can influence one another’s growth rates in Mt. Rainier National Park in Washington State.
“I… applied to the Incubator Program because I didn’t know where to begin on the data-intensive second chapter of my dissertation,” Graham said after the 2019 program concluded. “Through Dr. Rokem’s patient and thoughtful mentoring, I was able to not only make considerable progress on this project but also develop data management skills that have already helped me with other ongoing projects.”
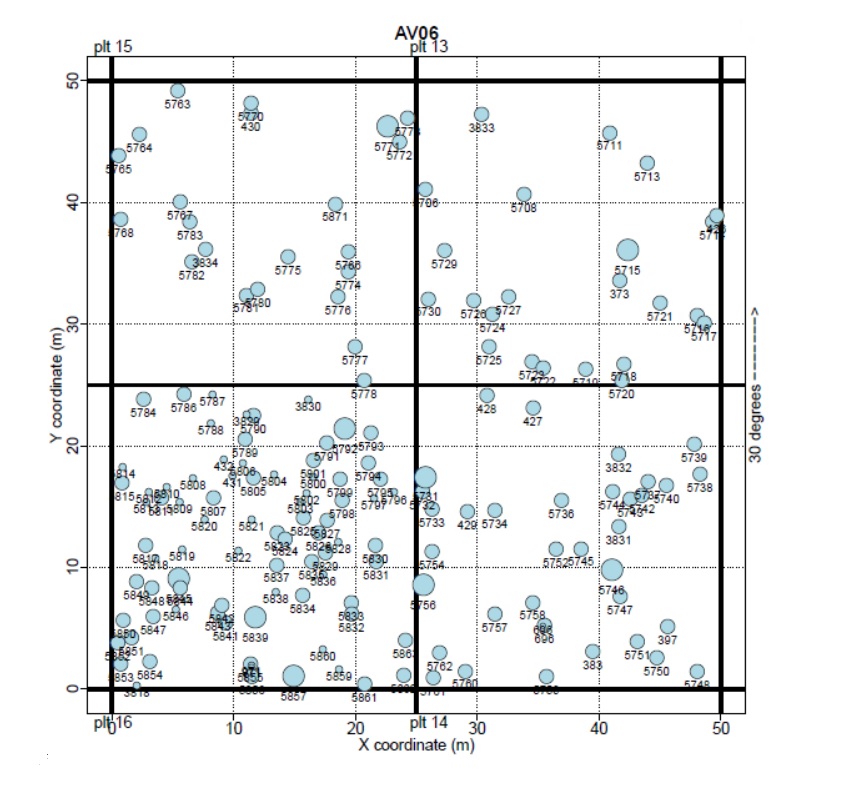
The research began with examining 40 years of tree growth data collected from 15 plots in the mature and old-growth conifer forests of Mt. Rainier National Park, each of which measured 100 x 100 meters. The tree locations were mapped within the plots, and the annual growth rates were extrapolated from the decades of existing measurements from the Pacific Northwest Permanent Sample Plot Program. Although 17 different tree species were identified in the dataset, the 6 most prolific were chosen as focal species for modeling: Pacific Silver Fir, Alaskan Yellow Cedar, Douglas Fir, Western Red Cedar, Western Hemlock, and Mountain Hemlock.
The goal of the study was to determine if the growth rate of the focal trees was influenced by the presence of neighboring trees, and if the species of the neighbor tree made a difference or not. Would the growth rates be higher if the neighbor was the same species, or a different one? And could inferences be made about which neighboring tree species are associated with the highest and lowest focal growth rates? For example, the seedlings of most conifer trees species have higher growth rates when in close proximity to an adult tree of the same species, but it is unclear whether this same relationship holds true for the growth rates of two adult trees.
“Plants alter the soil near their roots in terms of its chemical composition and the species of bacteria and fungi that live there,” Graham explains. “These alterations influence how well other plants can grow in this soil.” Accurate predictions of tree growth can provide insight into current spatial patterns in carbon storage, as well as the effects of land use on timber production and global carbon cycling, which is nature’s way of recycling carbon atoms.
To better understand how the focal trees respond to the species of their neighbors over their entire life cycle, Graham and Rokem created a directional graph model of the data collected and modeled the annual growth rate of each tree as a linear function of its species, local tree density, and the species, size, and proximity of each neighboring tree. The more traditional methods of modeling are very complex and have been shown to result in good fits to the data, but previous research has not investigated how generalizable these models conclusions are to new datasets. “On the one hand, we want a model that fits our data well,” explains Graham. “But on the other hand, we want to avoid making our model too complex, because this can make the model and its conclusions less applicable to new datasets.”
Fitting the traditional models typically requires high-performance computing clusters and a separate model must be created for each hypothesis that is being tested, thereby further increasing the computation time needed and limiting the number of hypotheses that can be compared. “The biggest difference between our new regularized regression model and other available methods is speed,” says Graham. “Our new model fits in seconds to minutes on a personal laptop… We achieved this speed boost by making a number of simplifying assumptions.”
“There are many non-linear relationships that influence tree growth, and therefore domain-specialists were understandably skeptical of our simplified model,” Graham said. “In ecology we often model complex processes that are influenced by many partially-correlated variables.” Ecologists often develop more complex models to handle all these variables, but with huge datasets that span time and space, the computational process becomes cumbersome.
The team compared the results from their regularized regression model with several other traditional models that are commonly used among ecologists to verify the accuracy of their findings. “Our study showed that despite the simplifying assumptions, our new model arrived at the same answers to ecological questions as did the most popular traditional model,” said Graham. “We formed a collaboration with some ecologists who are highly experienced in tree growth modeling who helped us ensure that we were using the traditional methods to their fullest potential, and that [we] addressed the major questions other ecologists may have.”
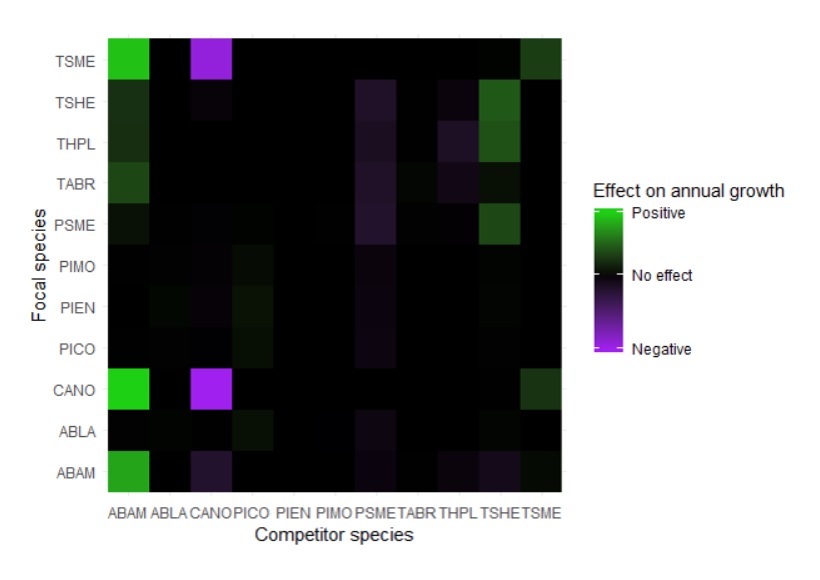
After the growth rates of the focal trees and their neighbors had been modeled, the team developed a matrix to display the relationship between the focal growth rate and whether it was positively or negatively influenced by the species of its neighbors. Each species was assigned a four-letter code that corresponded with the tree’s scientific name, and was mapped with the focal species and neighboring species on the y- and x-axes, respectively.
Stuart Graham and Ariel Rokem also developed ForestPlotR, an R package that fully explores tree growth datasets through visualizations, which include the tree species identity, size and proximity of neighbors, as well as the densities of each neighboring species, and all species combined in the plot. The package can be used by forest managers, ecologists, and other researchers as datasets quickly grow larger and more accessible.
Ultimately the team determined that the growth rate of the focal trees in Mt. Rainier National Park was indeed influenced by the neighboring trees and their species. Both the regularized regression and likelihood models agreed that the Pacific Silver Firs grew faster when they were surrounded by trees of their own species: “If a plant alters the soil in a way that enhances the growth of the same species, this can result in local dominance by this species and low diversity,” said Graham. On the other hand, the Alaskan Yellow Cedars, Western Hemlocks, and Mountain Hemlocks all grew faster when surrounded by neighbors of other species, “where the plant alters the soil in a way that benefits the growth of other species.” Neither the Douglas Firs nor the Western Red Cedars were substantially impacted by the species identities of their neighbors.
The new regularized regression model has a huge amount of potential because it can replicate the ecological inferences of a classical likelihood model in a fraction of the time. They may be particularly useful for predictive projects like this because they can include many correlated variables, such as competition between species. “We hope our work will encourage researchers in fields where it is common to have many correlated potential explanatory variables, [and] to consider trying regularized linear models before resorting to more complex alternatives,” said Graham. “This could make research fields that usually rely on complex models more accessible.”

The eScience Institute’s annual Winter Incubator program, where Stuart Graham and Ariel Rokem first collaborated on this project, is a fantastic opportunity for researchers in any field to combine their efforts with data scientists to tackle complex questions. “The ultimate success of this project can be attributed to its interdisciplinary nature, which led to productive conversations between data scientists and ecologists,” says Graham.
The 2022 Winter Incubator program, which kicked off on January 4th, features projects that address topics such as offshore earthquakes, phytoplankton, urban green spaces, spectral topography, and Covid-19 disinformation. “It was really interesting to view these projects in different fields through the lens of data science, and realize that they had many commonalities,” said Graham after the 2019 program concluded. “This experience helps me see links between research questions, and help me to envisage more interdisciplinary projects in the future.”