Project Lead: Will Kumler, UW Oceanography
Faculty Advisor: Anitra Ingalls, UW Professor of Chemical Oceanography
Data Science Lead: Bryna Hazelton
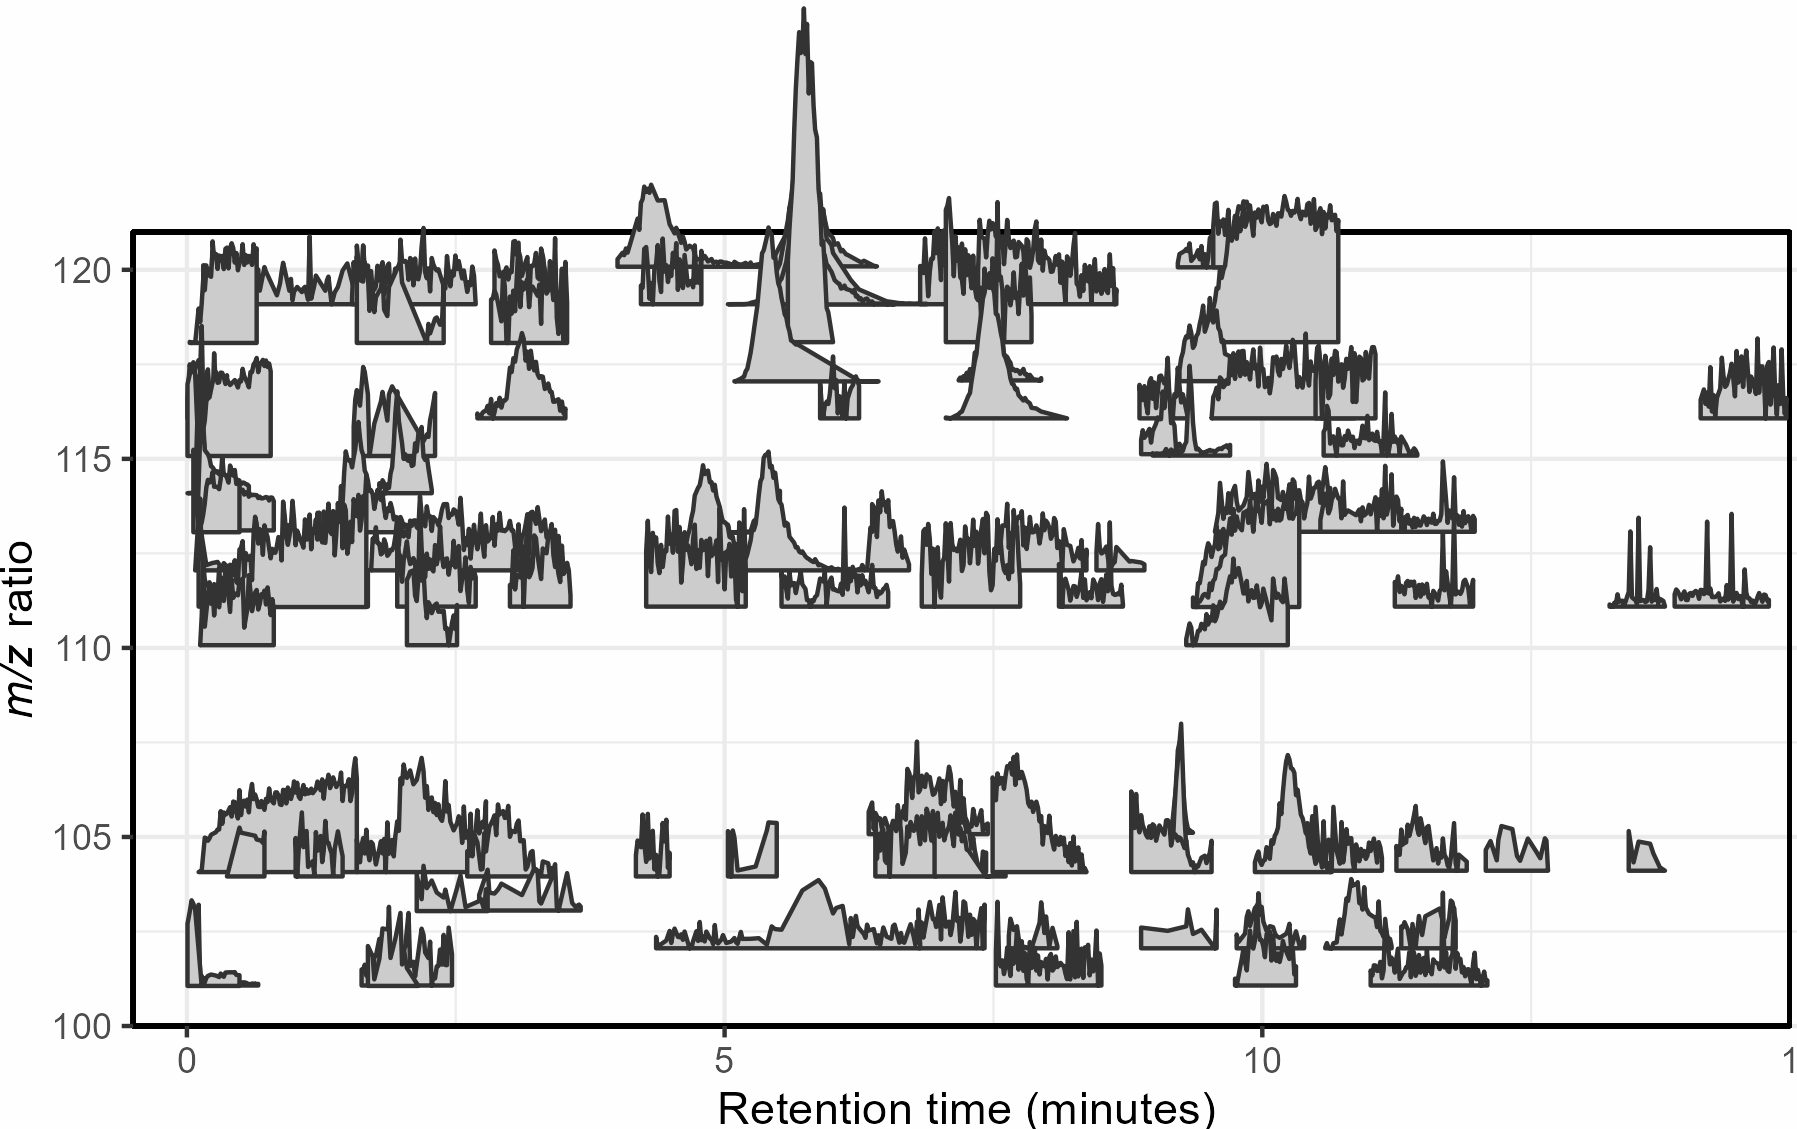
Mass spectrometry is a cutting-edge analysis field used to identify the molecular composition of samples taken from medical laboratories, the depths of the ocean, and even outer space. In the Ingalls Lab at UW, we use it to characterize the molecular composition of seawater and its inhabitants, a task complicated by the complex biogeochemistry of the oceans. The nascent nature of modern mass spectrometry also introduces many challenges, one of which is distinguishing biological/chemical signals from noise produced during the measurement process. Our goal was to calibrate existing detection algorithms to a probabilistic likelihood that the signal corresponds to a real molecular feature.
With guidance from Bryna Hazelton and the other data scientists at eScience, we focused on extracting useful features from the raw data and tested several different methods for converting these individual metrics into a predictive model. This model did an excellent job of predicting chromatographic peak quality within a given dataset and reduced the rate of false positives from ~90% to 10-20%. However, the initial model struggled to generalize across datasets even if they were also produced by the Ingalls Lab until we identified the strongest predictors and reduced the model to those few with the best performance. In the future, we’re planning to continue investigating how the model performs in different environments and make the results available to other labs in a clean R package. Along the way, we generated two fully-labelled chromatographic peak datasets and several tools for feature classification and extraction, all available on the MS_metrics GitHub repository.
