Project Lead: Rose Hilmo, UW School of Oceanography PhD Candidate
eScience Liaison: Joseph Hellerstein
The health and recovery of whale populations is a major concern in ocean ecosystems. This project is about using data science to improve the monitoring of whale populations, an ongoing area of research in ocean ecology.
Our focus is acoustic monitoring, a very effective tool for monitoring the presence and behavior of whales in a region over extended time periods. Ocean bottom seismometers (OBSs) that are used to record earthquakes on the seafloor can also be used to detect blue and fin whale calls. We take advantage of a large 4-year OBS deployment spanning the coast of the Pacific northwest to investigate spatial and temporal trends in fin and blue whale calling, data that provide an unprecedented scale for whale monitoring. Our main research question is: How does whale call activity vary in time (e.g., seasonally and annually) and space in the Northwest Pacific? Additionally, how does call variability relate to other parameters such as environmental conditions and anthropogenic noise such as ship noise and seismic surveys? This information will provide considerable insight into whale populations and ultimately into ocean ecology.
Over the past decade, our lab group has implemented many methods of blue and fin whale acoustic detection and location. This has generated large volumes of data on temporal and spatial calling patterns of these species in the Northeast Pacific. Our main goal of the data science incubator is to build and publish a SQL relational database of our compiled whale data. This will not only improve our own ability to work with our current data and easily integrate new data but will also allow others in our community to utilize our framework and incorporate their own data. Additionally, we will re-implement our whale detection codes (currently in MATLAB) in Python. These codes will be open source (on github), make use of the relational database, and incorporate software engineering best practices. It is our hope other researchers will apply our methods to study fin and blue whales using large OBS deployments in other key ecological regions such as Alaska, Hawaii, and Bransfield Strait (Antarctica).
Project Results
This project yielded two main deliverables: Well documented python code for detection of whale calls in an accessible github repository, and the framework of a SQL relational database for storing whale call and location data.
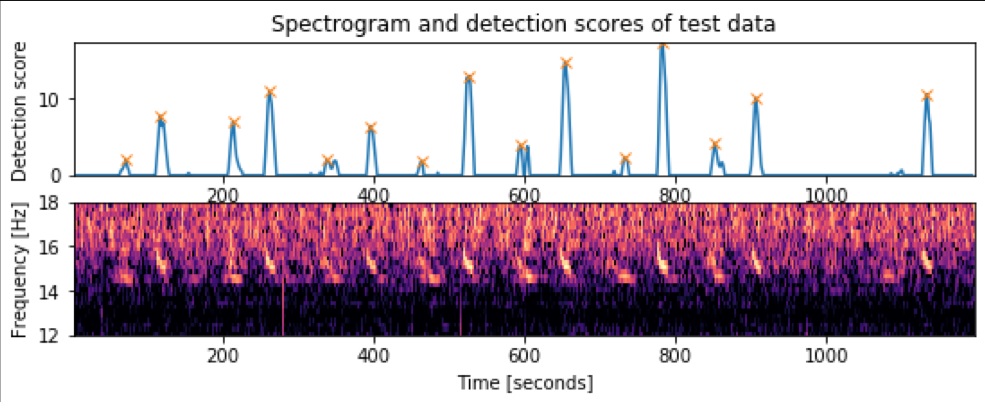
The python code package we developed during the incubator detects blue and fin whale calls recorded on ocean bottom seismometers. However, the code is flexible and can be used to detect calls on other instruments such as pressure sensors and hydrophones as well. We use a spectrogram cross correlation method where a kernel image matching the spectral dimensions of call is constructed and then cross-correlated with a spectrogram of timeseries data from an instrument. Areas where the kernel and spectrogram match result in peaks in the detection score which are then recorded as calls (figure 1). Call metrics of interest to whale ecologists such as signal-to-noise ratio, call duration, and times are stored in a pandas dataframe and then written to our database.
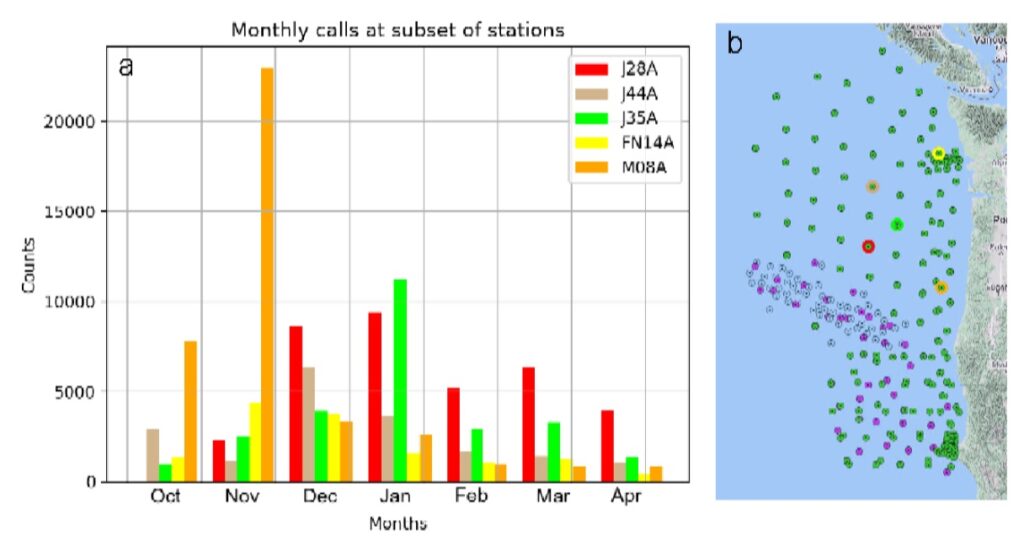
A central part of this project is the relational database. The database is structured using an information model that relates stations, channels, detections, and calls. We developed a python implementation of the database. This structure of database implementation was essential for two reasons. First, this structure streamlines data storage and use. Referencing and filtering associated information from different instruments, calls, and whale locations for analysis is simple using the relational database tables. Additionally, the open source nature of all tools used to build and access the database increases accessibility for others who want to use this data in their own research. As of the end of the incubator, we have filled the database only with test detections and locations on small portions of data. This will be filled more completely with 4 years of detection and location data from arrays of ocean bottom seismometers off the coast of the Pacific Northwest as we apply our methods large-scale (Figure 2b).
So far, we have only run our blue whale detector on one year of ocean bottom seismometer data from the large Cascadia Initiative array as a proof of concept. We did this to test the quality of our detector and consult with whale experts about any additional useful call metrics we should add to our database. We will improve our detector expand the database to include additional metrics such as frequency measurements and background noise levels before running code on the full set of data.
Figure 2a shows a monthly histogram of total blue calls from our test dataset detected on a subset of 5 stations of interest. Blue whale call presence on these stations shows a strong seasonality, present only from late fall through early spring. Call counts vary by location. Calls on stations in shallow water near the coast (FN14A and M08A) peak in November, earlier in the season than the other stations in deep water which peak in December-January. Much deeper analysis of spatial and temporal trends in blue whale calling will be possible once our method is run on the full set of data.