Project Lead: Alicia Hotovec-Ellis, Graduate Researcher, Earth and Space Sciences
Advisor: John Vidale, Professor, Earth and Space Sciences
eScience Liaison: Jake Vanderplas, Director of Research – Physical Sciences, UW eScience Institute
In this project, we aimed to provide an open-source tool for seismologists to cluster repeating earthquakes in continuous data. The primary focus was to do this in near real-time as part of network operations (e.g., for the Pacific Northwest Seismic Network (PNSN)), but also have the flexibility to work with archived data. Most processing of repeating earthquakes requires a priori knowledge of what the earthquakes look like, which is not possible in real-time.
In REDPy, we automatically detect and associate each new potential repeating earthquake. This is possible through an online clustering algorithm (IncOPTICS: Incremental Ordering Points To Investigate the Clustering Structure, Kriegel et al.), allowing us to more efficiently reduce the number of required calculations as the catalog grows. OPTICS also allows us to have flexible definitions of a cluster, and has minimal restrictions on how separated in time two repeats may be. We also utilize a database-like structure using PyTables to efficiently store and recall data.
The code is still in development, however, we have already made some strides in facilitating new research at Mount St. Helens. Once the code is completed and running at the PNSN, we will have increased automated monitoring of the active volcanoes in the Cascades. We also plan to share the code as an open source package to the rest of the seismological community, with the hope that it will offer a more standardized way of identifying repeating earthquakes in large datasets.
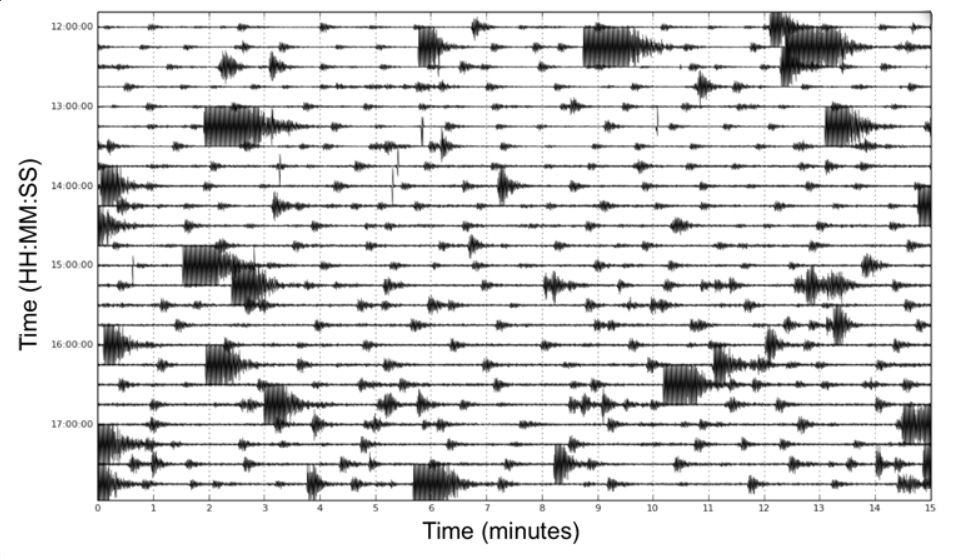
Figure 1 (below) is an example of a small test dataset from the beginning of the 2004 eruption of Mount St. Helens. We know from previous research that many, but not all, of the earthquakes during this time period are nearly identical to each other. Figure 2 is one of the outputs of REDPy, visualizing the identified repeating earthquakes in an ordering that makes clusters more visible. For example, the top ~50 rows comprise a cluster of highly similiar earthquakes, and a few smaller clusters are below that.