Project Lead: Gabe Wisswaesser, School of Environmental & Forest Sciences
eScience Liaison: Spencer Wood
As public land use increases, accurate visitation numbers are paramount to managers and researchers interested in mitigating and understanding anthropogenic effects. Alpine water quality, as of late, has been under exceptionally high pressure because human waste mitigation is not keeping up with increases in backcountry use. Data concerning backcountry visitation is sparse, and attempts to model it accurately in National Parks is an essential next step in quantifying use. This incubator project is testing approaches for using publicly available, geotagged, social-media data, and other variables to predict visitation to sites in Mount Rainier National Park (MORA). Collaborating with MORA officials, this project delineated park regions that had useful existing trail-count data, prioritizing those locations that are isolated and remote with only one access route. Social media posts that fell within these designated spatial zones were combined with the other predictive factors like precipitation, institutional closures, and week-of-year to estimate visitation, based on relationships of variables with on-site counts of hikers. This model of visitation tied to my work quantifying human enteric waste in alpine waterways may offer other National Parks and public lands methods to evaluate potential impacts of their backcountry use.
Project Results
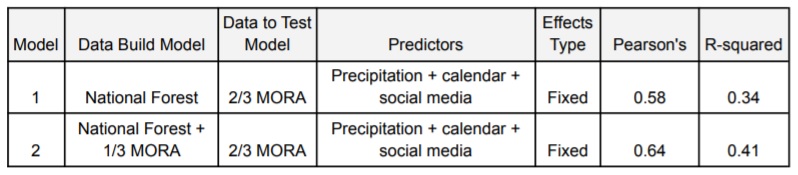
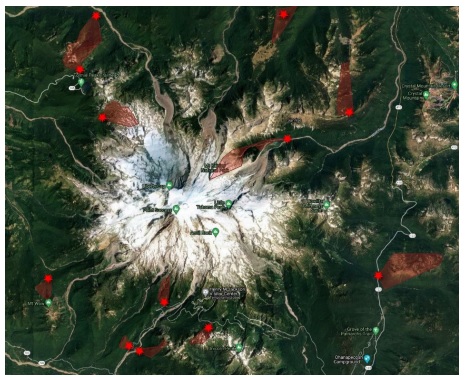
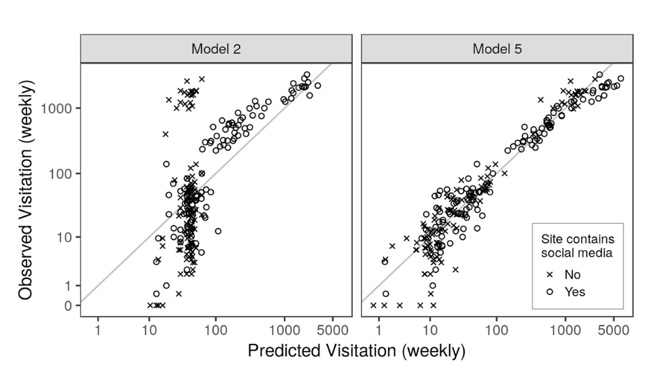
Study sites in MORA were selected on two primary conditions: (1) the trail was monitored with an infrared pedestrian counter that captured all traffic, essentially out-and-back trails, and (2) data were collected within the last six years (2015-2020). Polygons were drawn to reflect the areas that would capture all visitors logged by infrared pedestrian counters. These polygons then provided the boundaries for social media posts associated with counter data. The on-site counts and social media posts for each site within MORA were then used to test the ability of a visitation model, parameterized in Mount Baker-Snoqualmie National Forest (MBS) (Wood, et al. 2020), to predict visitation at similar sites within the National Park. Model 1 was created using MBS data and tested using only MORA data onsite counts. Model 2 was built using MBS data dn ⅓ of the available data from MORA and tested with the other ⅔ of MORA count data (Table 1). Model 1 had an average Pearson’s of 0.58 and an R-squared of 0.34 and model 2 had a Pearson’s of 0.64 and an R-squared of 0.41 (n=1000). The next steps to help explain error will be the inclusion of an indicator variable to capture unknown categorical differences in between MBS and MORA and the addition of random effects creating a mixed effects model. For the time being there is no difference between the models, but there is room for improvement. The hope is to further develop this model into a tool capable of explaining enough error to complement my work assessing the effects of human interactions with aquatic environments in remote locations.