Project Lead: Charles Zhou, Anesthesiology & Pain Medicine Staff Scientist
eScience Liaison: Ariel Rokem
In 2017, 1.7 million people in the United States reported addiction to opioid pain relievers (Center for behavioral Health Statistics and Quality, 2017) while 47,000 individuals died from opioid overdose (CDC, 2018). Understanding the mechanisms of substance use disorders and developing targeted treatments are monumental challenges due to the facts that the responsible brain regions are situated deep within the brain and possess highly diverse neuron populations and circuitry. To tackle this challenge, laboratories at UW’s NAPE (Neurobiology of Addiction, Pain, and Emotion) center utilize 2-photon calcium imaging to record from hundreds of neurons in animal deep brain structures simultaneously during drug seeking behaviors. Briefly, this method combines high temporal and spatial resolution microscopy with cell-type specific fluorescent neural activity readout to produce videos of brain activity where single neurons can be resolved. As a result, for a given animal subject one can track over a thousand neurons over the course of several days of behavior and drug administration assays; however, sophisticated data analysis techniques to dissect how activity patterns across hundreds of thousands of neurons relate to behavior and addiction remain underdeveloped. The aim of this project is to apply novel statistical and machine learning analysis techniques to large-scale 2-photon calcium imaging data with respect to addiction-related behaviors and assays.The project plan is to first perform dimensionality reduction on the mouse calcium imaging videos using tensor component analysis (Williams AH et al., 2018, Neuron) then to use those data to predict behavioral conditions using a convolutional neural network. Once the neural network is able to discriminate behavioral conditions, I can examine the spatial maps that are learned by the neural network nodes. The overall significance of this project is to gain insight to spatially distributed neural patterns that underlie addiction behaviors, allowing for targeted development of drug addiction therapies.
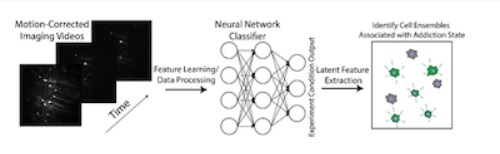
Calcium imaging data with experimental condition labels will be used to train a convolutional neural network. Latent cell activation patterns will be identified from the model. Panel on the right represents a cartoon sample cell pattern identified by feature extraction.
Project Results
We wrote and performed all analyses using Python Jupyter Notebooks and modularized Python scripts edited in Pycharm. We utilized the following Python packages: xarray for organizing the data, scikit-learn for dimensionality reduction, and matplotlib for data visualization.
Input data was a calcium imaging video (3D dataset with dimensions: x pixels, y pixels, and frames/time) that had already undergone motion correction. Importantly, this recording was made in a mouse during a classical conditioning behavioral task. This task consisted of trials where a tone was presented with a sucrose reward (CS+ rewarded) and trials with a different tone by itself (CS-). Further preprocessing involved extracting snippits of the video for each trial, sorting these trials by behavioral condition, and flattening the space dimensions (x and y).
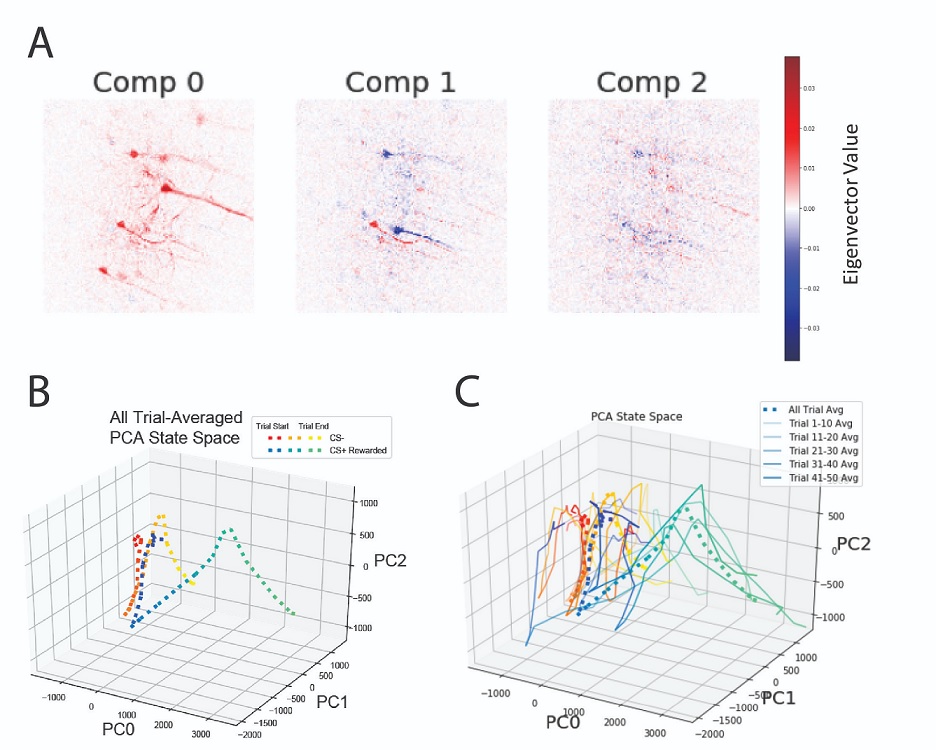
Our primary analysis involved performing principal component analysis (PCA) to reduce dimensionality in the pixel dimension. The resulting principal components represent groups of pixels that share common temporal dynamics. To set the PCA space up, we fit a model using the trial- and condition-averaged data (dimensions were frames across the trial epoch by pixels). Upon inspection of the explained variance and the eigenvectors pixel weightings, we found the top three components explained about 30% of the variance and had spatial distributions matching biological neurons (Fig 2A). To compare how activity during the two conditions evolved across these top 3 principal components, we then transformed trial-averaged data for each condition using the aforementioned fitted model and projected the activity traces into the 3D space consisting of the top 3 principal components (Fig 2B). We found that the two trial conditions diverged substantially later in the trial (when the animal drank the reward for the CS+ condition) with respect to the first principal component. Finally to examine finer temporal structure across the session, we split and binned the trials into 5 groups, performed PCA transformation, and plotted into 3D space (Fig 2C). We observed a potential evolution of increased activity over the course of binned trials for the CS+ condition with respect to the first principal component.
While we were pleasantly distracted by the PCA method during the incubator, many more analyses can be performed to follow up. Namely TCA was mentioned in the project description; we started on this analysis however initial results did not quite line up with PCA results (not shown). Also because differences between conditions could be visualized in the PCA, the data may lend itself nicely to machine learning classification. Overall, these results highlight the potential of dimensionality reduction techniques to gain insight to population spatio-temporal activity patterns related to addiction-related paradigms.
References
Williams AH, Kim TH, Wang F, Vyas S, Ryu SI, Shenoy KV, Schnitzer M, Kolda TG, Ganguli S. Unsupervised Discovery of Demixed, Low-Dimensional Neural Dynamics across Multiple Timescales through Tensor Component Analysis. Neuron. 2018 Jun 27;98(6):1099-1115.e8. doi: 10.1016/j.neuron.2018.05.015. Epub 2018 Jun 7.