Project Lead: Stuart Ian Graham, UW Biology Department
eScience Liaison: Ariel Rokem
A quantitative understanding of how co-occurring tree species influence one another’s growth is required to predict how forest ecosystems will respond to climate change. Although competition with neighboring trees undoubtedly limits tree growth, the species identity of neighbors may have an important role in moderating this interaction.
For example, the seedlings of most conifer tree species have higher growth rates when close to an adult tree of the same species, whereas the opposite is true for many tropical tree species. However, it is currently unclear how these feedbacks influence the growth of adult trees. To fully comprehend the role of these feedbacks in structuring forest communities, we need to build an understanding of how trees respond to the species identity of their neighbors over their entire life cycle.
This project aims to create a statistical model to describe how the growth of adult trees is influenced by the size, species identity, and proximity of neighboring trees. It will use 40 years of growth data collected from 15 forest plots at Mount Rainier National Park, WA.
Within these 100 x 100 m plots, the location of each tree is mapped, such that the neighbors of any tree can be identified. In total, the dataset includes over 8000 trees from 10 species. The code used for this analysis will be released in a user-friendly format such that it can be used by the many forest management agencies that maintain similar datasets to the one used in this project.
Project Results
Predicting how forest ecosystems will respond to contemporary climate change requires a quantitative understanding of how tree growth is influenced by neighboring trees. To build this understanding we must use large tree growth datasets in order to capture adequate variation in the many parameters that describe a tree’s competitive environment i.e. what tree species are nearby, how large are they, and how far from the focal tree are they? Although previous research has developed a modeling approach to estimate the effects of these variables on tree growth, construction of the model requires a supercomputer in order to optimize over many parameters and also returns coefficients that are not easily interpretable or comparable. This is unfortunate because the majority of datasets suitable for these analyses are built and maintained by forest management agencies which do not have the time or resources to implement the current modeling approach. This project aimed to create a new method to model tree growth as a function of neighboring trees that is quick and returns coefficients that are easily interpreted.
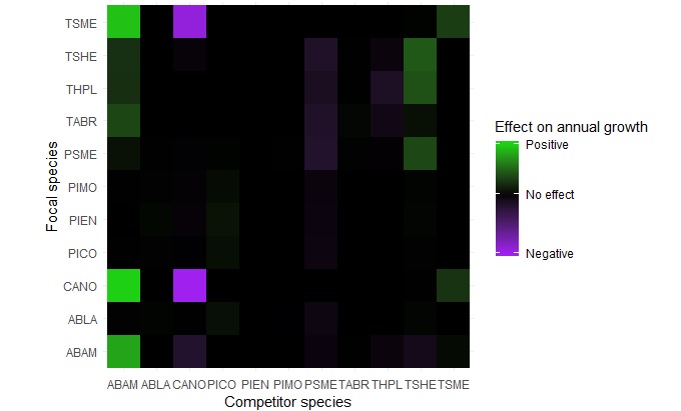
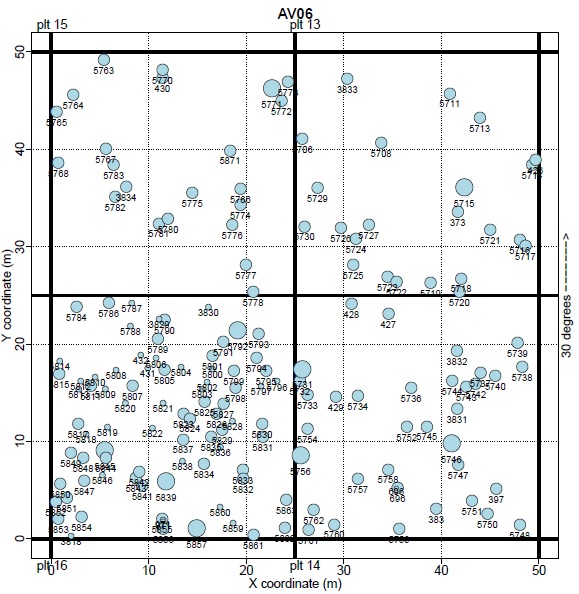
We used data on tree growth gathered from 15 forest plots at Mt. Rainier National Park. All trees in each plot are mapped and identified to species, enabling us to accurately describe the competitive environment of each tree (Fig. 1). We then created a directional graph model of these data, and modeled the annual growth rate of each tree as a linear function of its species, local tree density, and the species, size and proximity of each neighboring tree. The linear nature of this model means that it can run in < 10 seconds on a laptop and also returns coefficients that are in units of annual growth rates. From our model we developed a matrix that shows how the growth rate of each tree species is influenced by the species identity of a neighboring tree (Fig. 2). We are also developing an R package containing all the functions used to explore our data through visualizations and create our model, which will make this approach readily available to forest managers and other researchers.
The next step of this project is to obtain code from the authors of the previous modeling approach so that we can compare the performance of our new model and this older model. We will then finish documenting our R package and make it publicly available before writing up our findings in a manuscript for a peer-reviewed journal.