Project Lead: Jay Rutherford, UW Department of Chemical Engineering PhD Candidate
eScience Liaison: Bernease Herman
Air pollution is estimated to cause 4.9 million premature deaths and result in 149 million disability adjusted life years annually.(1) 91% of the world’s population lives with air pollution levels above the World Health Organization Guidelines.(2) These facts make it the world’s largest environmental health risk. Air pollution consists of gases, liquids and solids. Tiny droplets of liquid and microscopic solids suspended in the atmosphere are referred to as aerosols or particulate matter (PM). PM comes from natural sources including sea spray, forest fires, and dust from soil as well as anthropogenic sources like combustion engines, road dust, industry, residential heating and agricultural burning. There is extensive research showing PM2.5 (particulate matter smaller than 2.5 microns in diameter) causes a variety of health problems that lead to premature death and reduced quality of life. Some studies show certain sources of PM2.5 pollution, traffic for example, are worse for health than others, however, there is not sufficient evidence from source specific studies to show this conclusively. Recently there has been a proliferation of low-cost instruments to measure PM2.5, but there is no accompanying low-cost method to determine the sources of PM that is needed to enable the study of source specific health effects.
To enable low-cost source apportionment, we are developing a method to analyze PM samples using fluorescence excitation-emission matrix spectroscopy (EEM). PM samples contain fluorescent compounds such as polycyclic aromatic hydrocarbons generated during combustion that can be extracted into a solvent for analysis by EEM spectroscopy. We have collected PM in the laboratory and analyzed extracts using EEM spectroscopy. Using these data, we trained a convolutional neural network (CNN) to distinguish the sources of air pollution present in the laboratory samples.(3)
Project Results
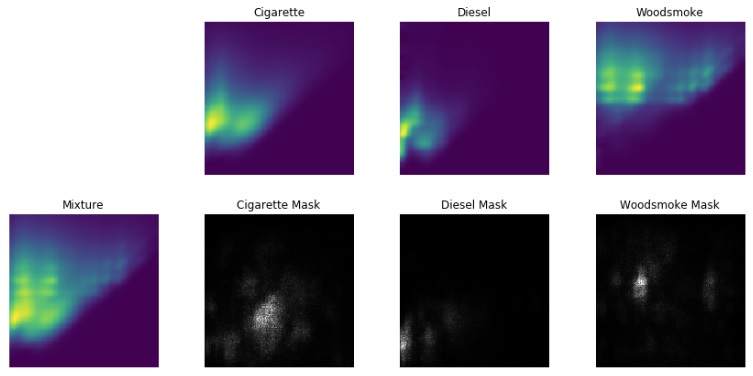
In order to apply EEM to source apportionment of real world samples, we needed to better understand why the CNN was working for the laboratory samples. To provide insight into what features of the spectra the CNN was using to identify the various laboratory sources of pollution we evaluated saliency maps from the trained network. This method calculates the sensitivity of the CNN output with respect to each area of an input spectra. This is a method typically applied to image classification, for example in an image containing a dog and a soccer ball, one expects the dog to be highlighted in the saliency map if the image is identified as a dog. Spectra from pure laboratory PM sources are shown in the top row of the figure, each source has a unique fingerprint. The spectra shown at the far left is a mixture of the three sources. The panels directly below the pure spectra are saliency masks corresponding to each of the laboratory sources. These maps show the CNN is looking at areas of the mixture spectra where the pure spectra show their unique fingerprints giving us confidence the CNN architecture we chose is working properly.
We computed saliency maps using SmoothGrad(4) based on our CNN that was trained using Keras. We are currently working to generalize the methods we used for processing EEM spectra, training a CNN and computing saliency maps into an open source Python package. This project can be found at pyeem Python package on GitHub.
References
(1) Stanaway, J. D.; Afshin, A.; Gakidou, E.; Lim, S. S.; Abate, D.; Abate, K. H.; Abbafati, C.; Abbasi, N.; Abbastabar, H.; Abd-Allah, F.; et al. Global, Regional, and National Comparative Risk Assessment of 84 Behavioural, Environmental and Occupational, and Metabolic Risks or Clusters of Risks for 195 Countries and Territories, 1990–2017: A Systematic Analysis for the Global Burden of Disease Study 2017. The Lancet 2018, 392 (10159), 1923–1994. https://doi.org/10.1016/S0140-6736(18)32225-6.
(2) WHO | Air pollution http://www.who.int/airpollution/en/ (accessed Apr 4, 2019).
(3) Rutherford, J. W.; Neal Dawson-Elli; Anne. M. Manicone; Gregory V. Korshin; Igor V. Novosselov; Edmund Seto; Jonathan D. Posner. Excitation Emission Matrix Fluorescence Spectroscopy for Aerosol Source Identification. (In Review).
(4) Smilkov, D.; Thorat, N.; Kim, B.; Viégas, F.; Wattenberg, M. SmoothGrad: Removing Noise by Adding Noise. ArXiv170603825 Cs Stat 2017.