Project Lead: Julian Olden with Rachael Fricke, both UW School of Aquatic and Fishery Sciences
eScience Liaison: Spencer Wood
Invasive species pose a significant threat to ecosystem health and economies of nations across the globe. Freshwater recreational fishing is the largest and growing vector for invader introductions: specifically, because angler activities entangle invasive organisms on fishing gear, boat hulls, and outboard engines, or release non-native species after using them as live bait. Understanding angler movement and behavior can provide critical insight into the most effective implementation of prevention strategies (e.g. watercraft inspection stations, educational signage), thus reducing the introduction, spread and impact of invaders.
To date, angler behavior is inferred from sparsely conducted in-person interviews, creels, dairies and mail-in surveys, which tend to produce retrospective data that is limited in time and space and often reveals intensions or attitudes rather than actual behaviors. Moreover, these traditional approaches disproportionately target older anglers and thus fail to engage younger generations whose participation in fishing is rapidly increasing.
Mobile technologies offer a novel opportunity to efficiently collect information on angler behavior at fine spatial and temporal resolutions over broad spatial and temporal scales. Yet, social media and smartphone fishing applications remain an underutilized tool. Anglers are highly active on social media who often geotagged photographs of fish, and fishing applications provide waterbody-specific location of anglers. This can reveal angler behavior that continuous in both space and time, and can provide inexpensive and high-resolution regarding the potential dispersal pathways of aquatic invasive species.
The primary objective of this incubator is to leverage data from social media and mobile fishing applications to quantify angler activity and movement across the continental United States and assess species invasion risks associated with recreational fishing. Results from this incubator will directly inform interagency management interventions at both local and landscape scales by quantifying angler movement networks and determining how they change through time. Heavily-used locations of fish activity (i.e., highly-connected network nodes) are prime targets for collaborative regulatory approaches that focus on the implementation of prevention strategies, such as watercraft inspection and cleaning stations to remove invasive species, and educational signage to discourage anglers from releasing live bait into waterbodies.
Project Results
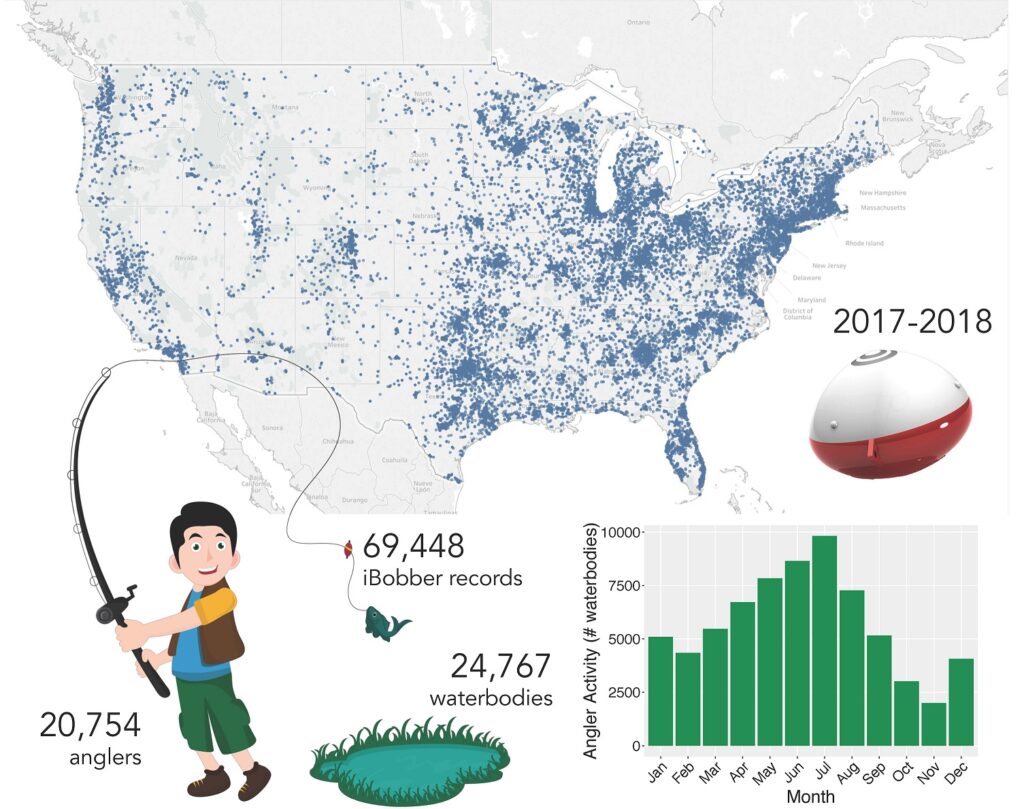
We mapped the geography of angler activity across the United States according to events recorded by the NetFish mobile app and geolocated photographs that are shared publicly on Flickr. NetFish interfaces with devices called iBobbers – the smallest and lightest personal sonar depth finder on the market – that anglers cast into the water, primarily to measure depth and detect fish. NetFish currently archives all user-generated data, which includes geographic locations and dates of fishing events (Fig. 1).
We filtered all iBobber records and Flickr images to include only those taken on waterbodies, resulting in a total of over 45,000 visits between ca. 7,000 waterbodies in the Pacific Northwest over the past 10 years. Distances traveled between any two waterbodies was estimated using the GraphHopper routing API. Network theory was used to create mathematical graphs depicting the number of linkages between waterbodies that were located less than the median distance travelled by anglers.
This resulted in a network of 353 waterbodies with 50 components (i.e., groups of interconnected waterbodies). Results from this incubator will directly inform interagency management interventions at both local and landscape scales by quantifying angler movement networks and determining how they change through time. Heavily-used locations of fish activity (i.e., highly-connected network nodes) are prime targets for collaborative regulatory approaches that focus on the implementation of prevention strategies, such as watercraft inspection and cleaning stations to remove invasive species, and educational signage to discourage anglers from releasing live bait into waterbodies.