Project Lead: Masha Vernik, UW Environmental and Forest Sciences
Data Science Lead: Curtis Atkisson
Description: As seasons become less predictable and extreme weather events become more intense and frequent, farmers learn to adapt. Adaptation can mean anything from building new infrastructure that’s out of a flood zone to installing improved irrigation lines; it can mean shifting crop plans or building deeper relationships with customers and fellow farmers. But for some farmers, adaptation is easier than for others.
What influences the challenges farmers face when adapting to climate change? To answer this question, I built a Bayesian structural equation model to investigate how land access affects organic farmers’ perceived capacity to adapt to climate change. In my model, land access is measured by farm size, land tenure, land use, and perceived challenges accessing land. Other variables in the model represent exposure to climate change and access to financial capital. I chose to explore land access based on 28 interviews I conducted with organic vegetable farmers in western WA about how they’re experiencing and adapting to climate change, where I heard that insecure land tenure can hamper the ability to make necessary investments to adapt to changing conditions. Bayesian approaches offer a promising way to integrate such qualitative findings into quantitative analyses, while accounting for uncertainty inherent in complex socio-ecological systems.
The farm-level data was collected as part of a national survey of organic farmers by the Organic Farming Research Foundation for the 2022 National Organic Research Agenda, in conjunction with the Organic Seed Alliance for the 2022 State of Organic Seed Report.
With the support of eScience Data Scientist Curtis Atkisson, I have been able to build a Bayesian structural equation model for organic farmers’ perceived capacity to adapt to climate change. I computed and integrated metrics for climate exposure variables, including temperature variability, precipitation variability, extreme heat, and drought, which were then used in the model. I built, assessed, and compared models that included different groups of explanatory variables and different prior beliefs. The model results suggest that at the population scale, land access does not have a strong association with perceived adaptive capacity. Variables representing access to financial capital and exposure to precipitation variability and extreme heat are more strongly associated with perceived adaptive capacity.
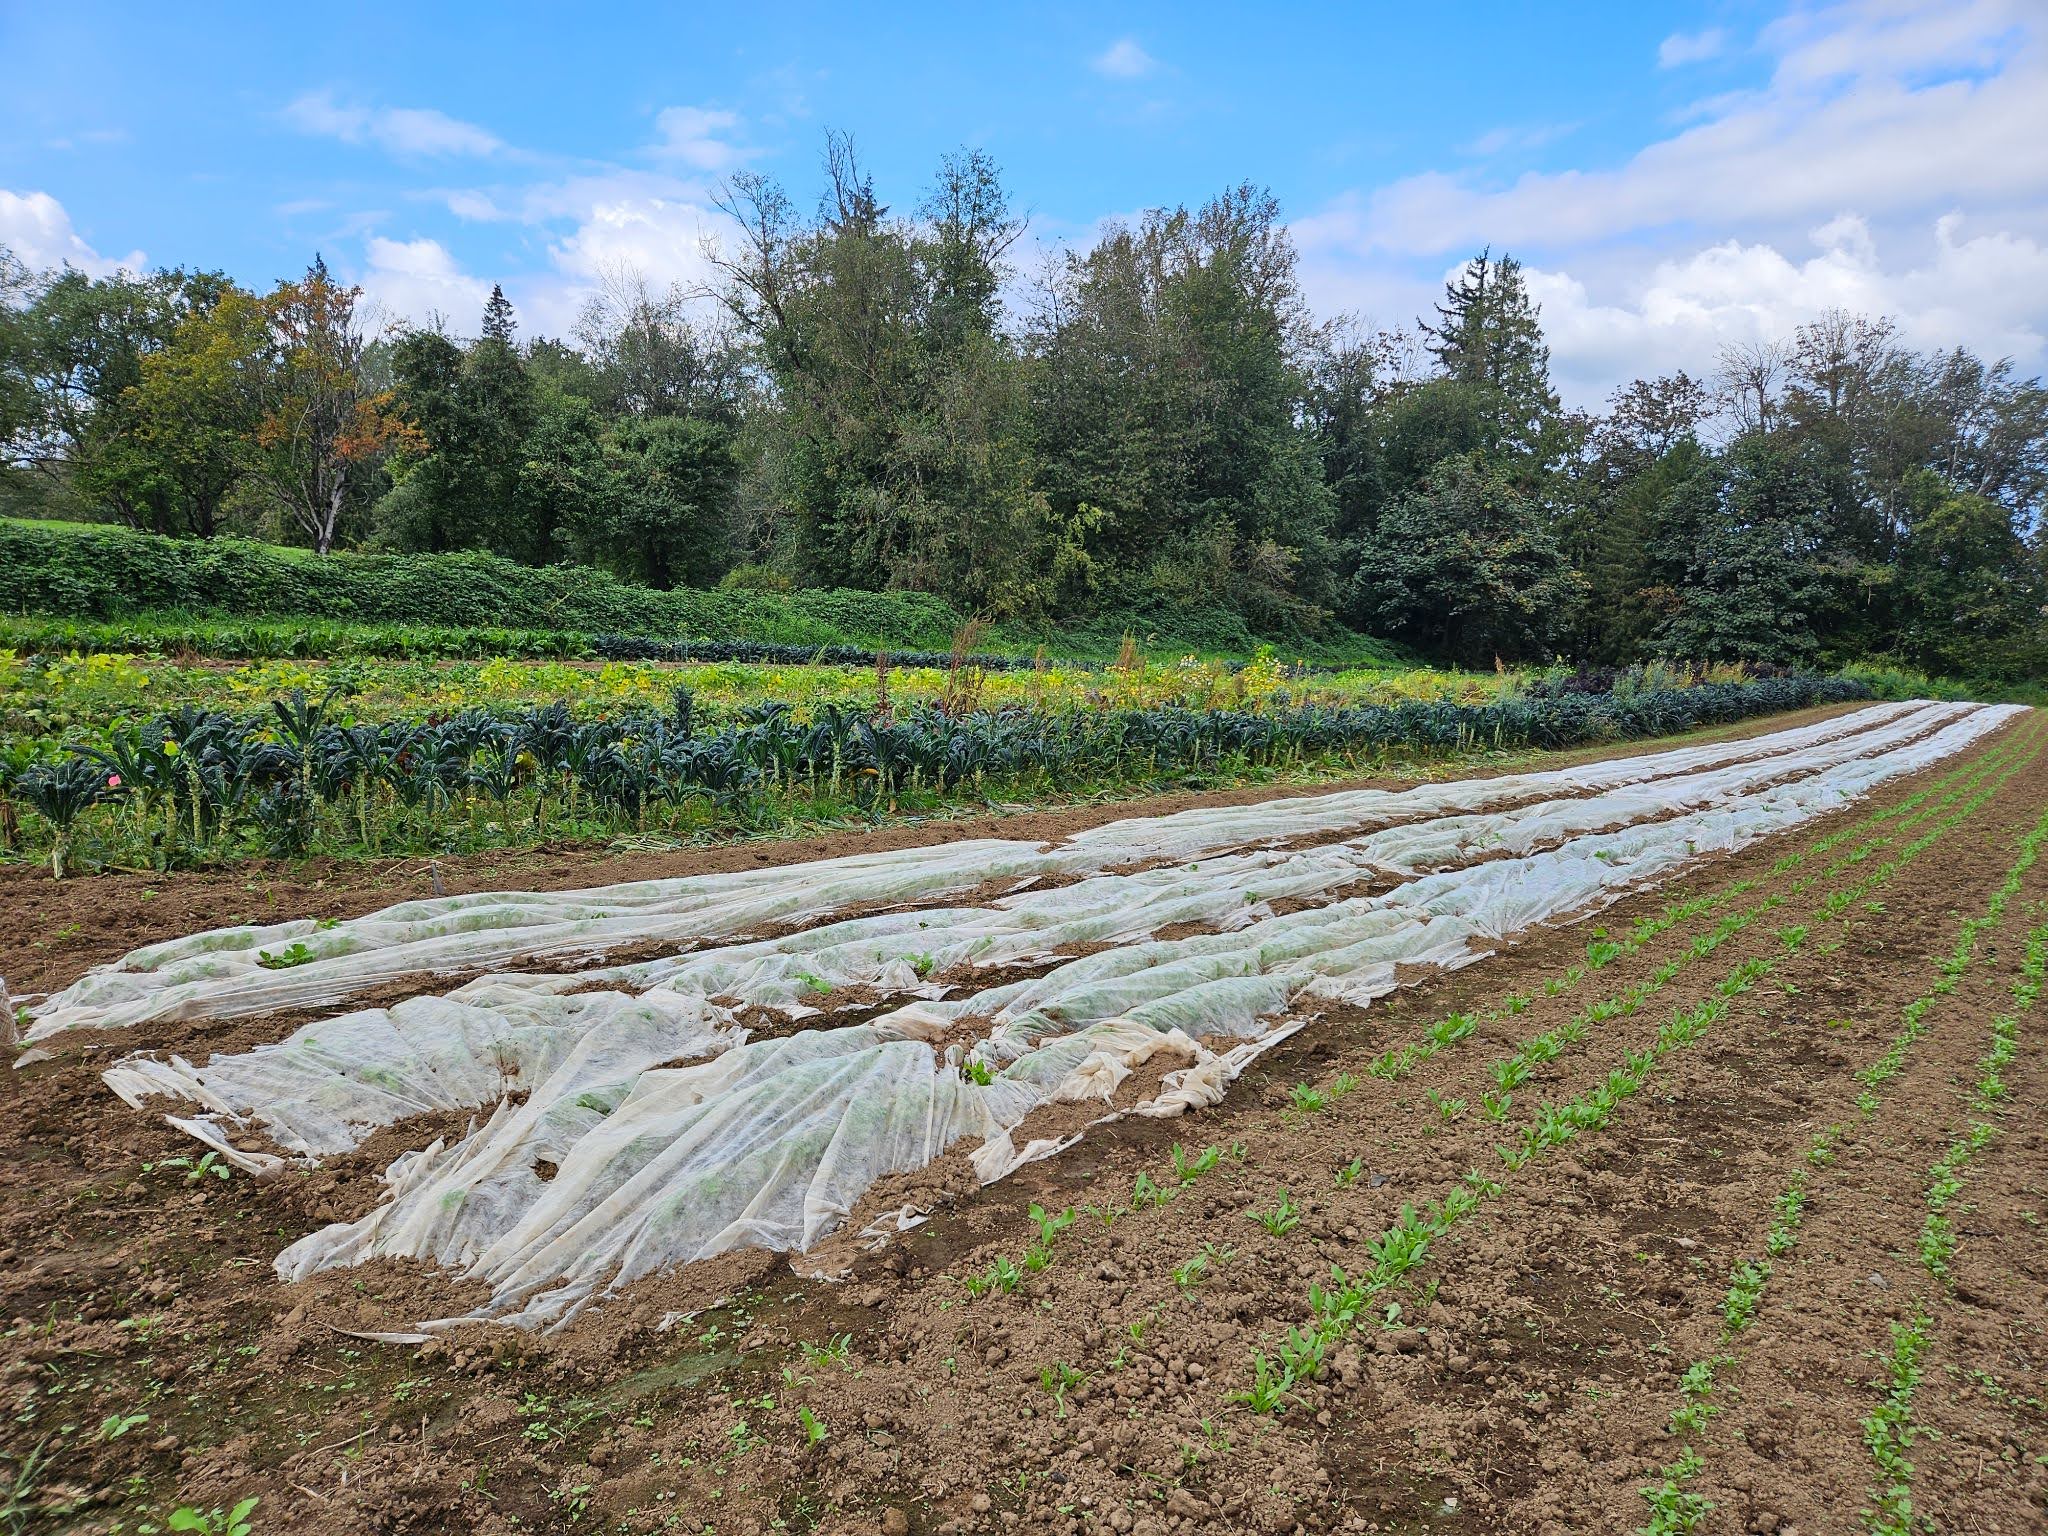
Image Caption: Photo of a diversified, organic farm in western Washington.