
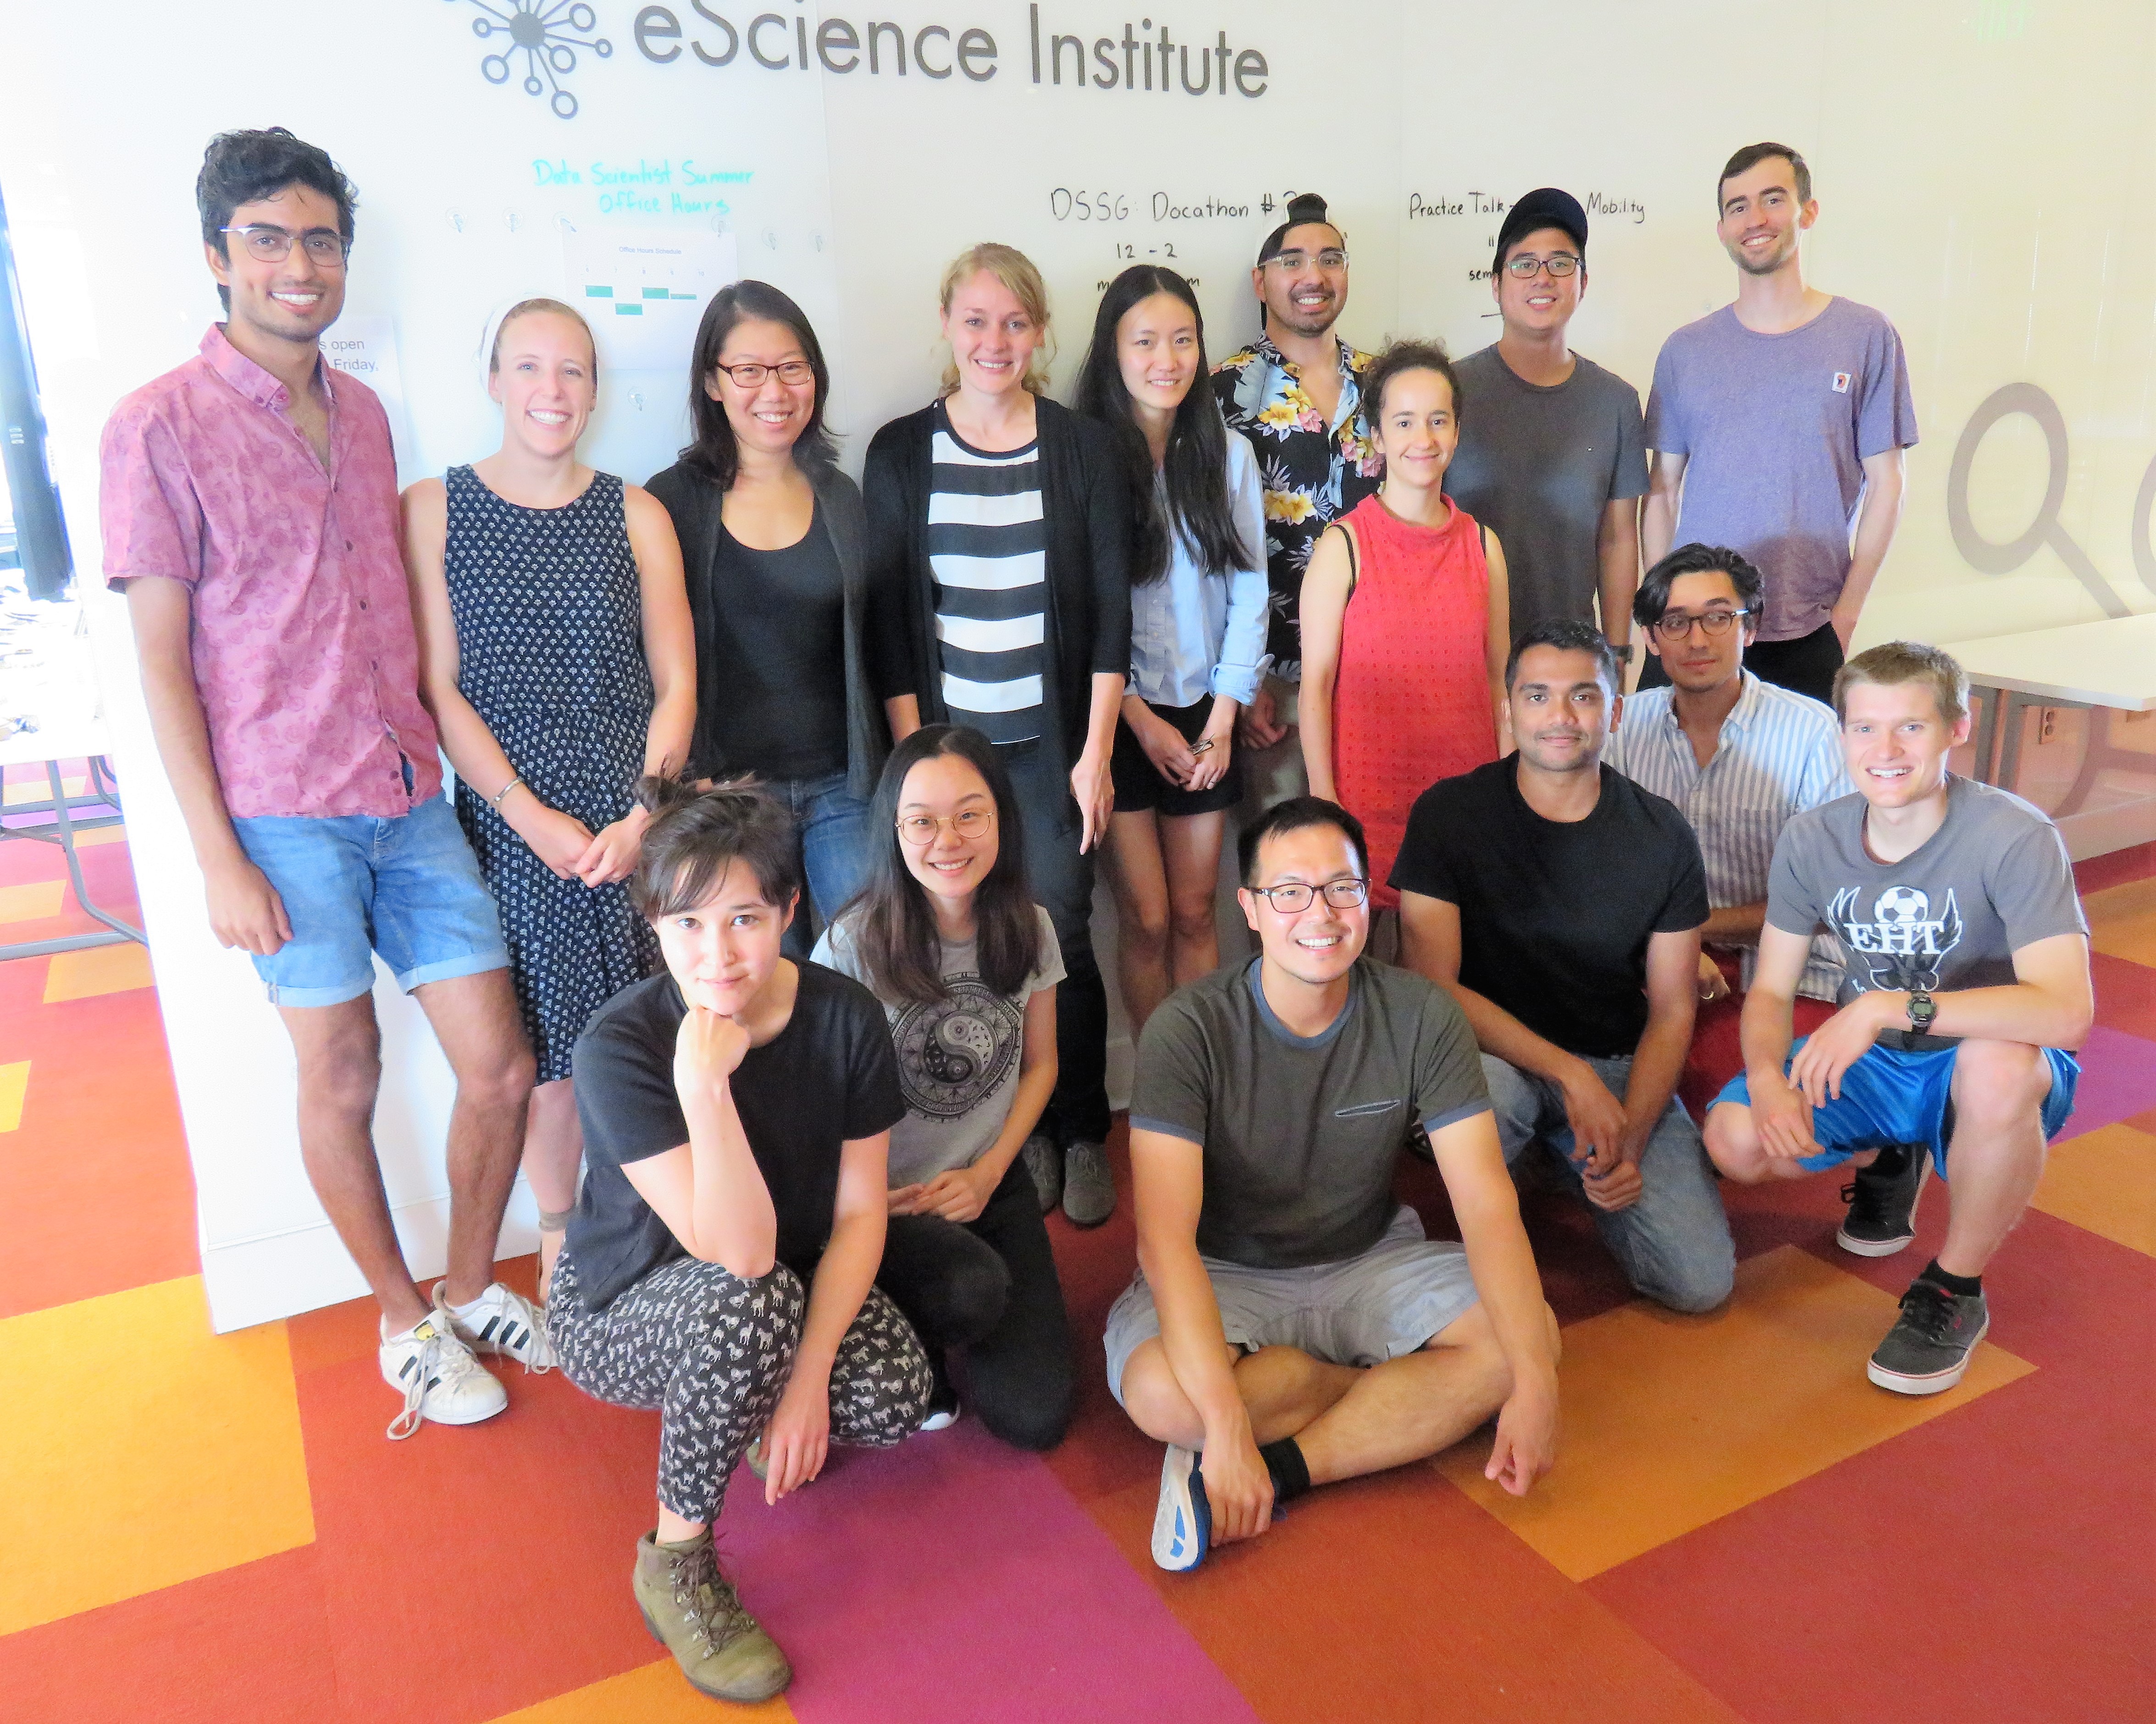
The fourth annual Data Science for Social Good (DSSG) program at the eScience Institute culminated on August 17th with final presentations from three interdisciplinary teams. The 15 DSSG Student Fellows – representing fields from public policy and sociology to biology, statistics and electrical engineering – presented their findings based on 10 weeks of full-time work with in-house data scientists and project leads from the academic, nonprofit and public sectors. Stakeholders, students and members of the public attended the presentations. The DSSG program combines technical skills with socially relevant projects to benefit the public good.
The following projects were completed:
Disaster Damage Detection Project
Imagery data after hurricanes can help guide emergency managers in the recovery effort. However, data collection and annotation processes largely rely on manual processes that could be improved with the application of coordinated data science techniques.
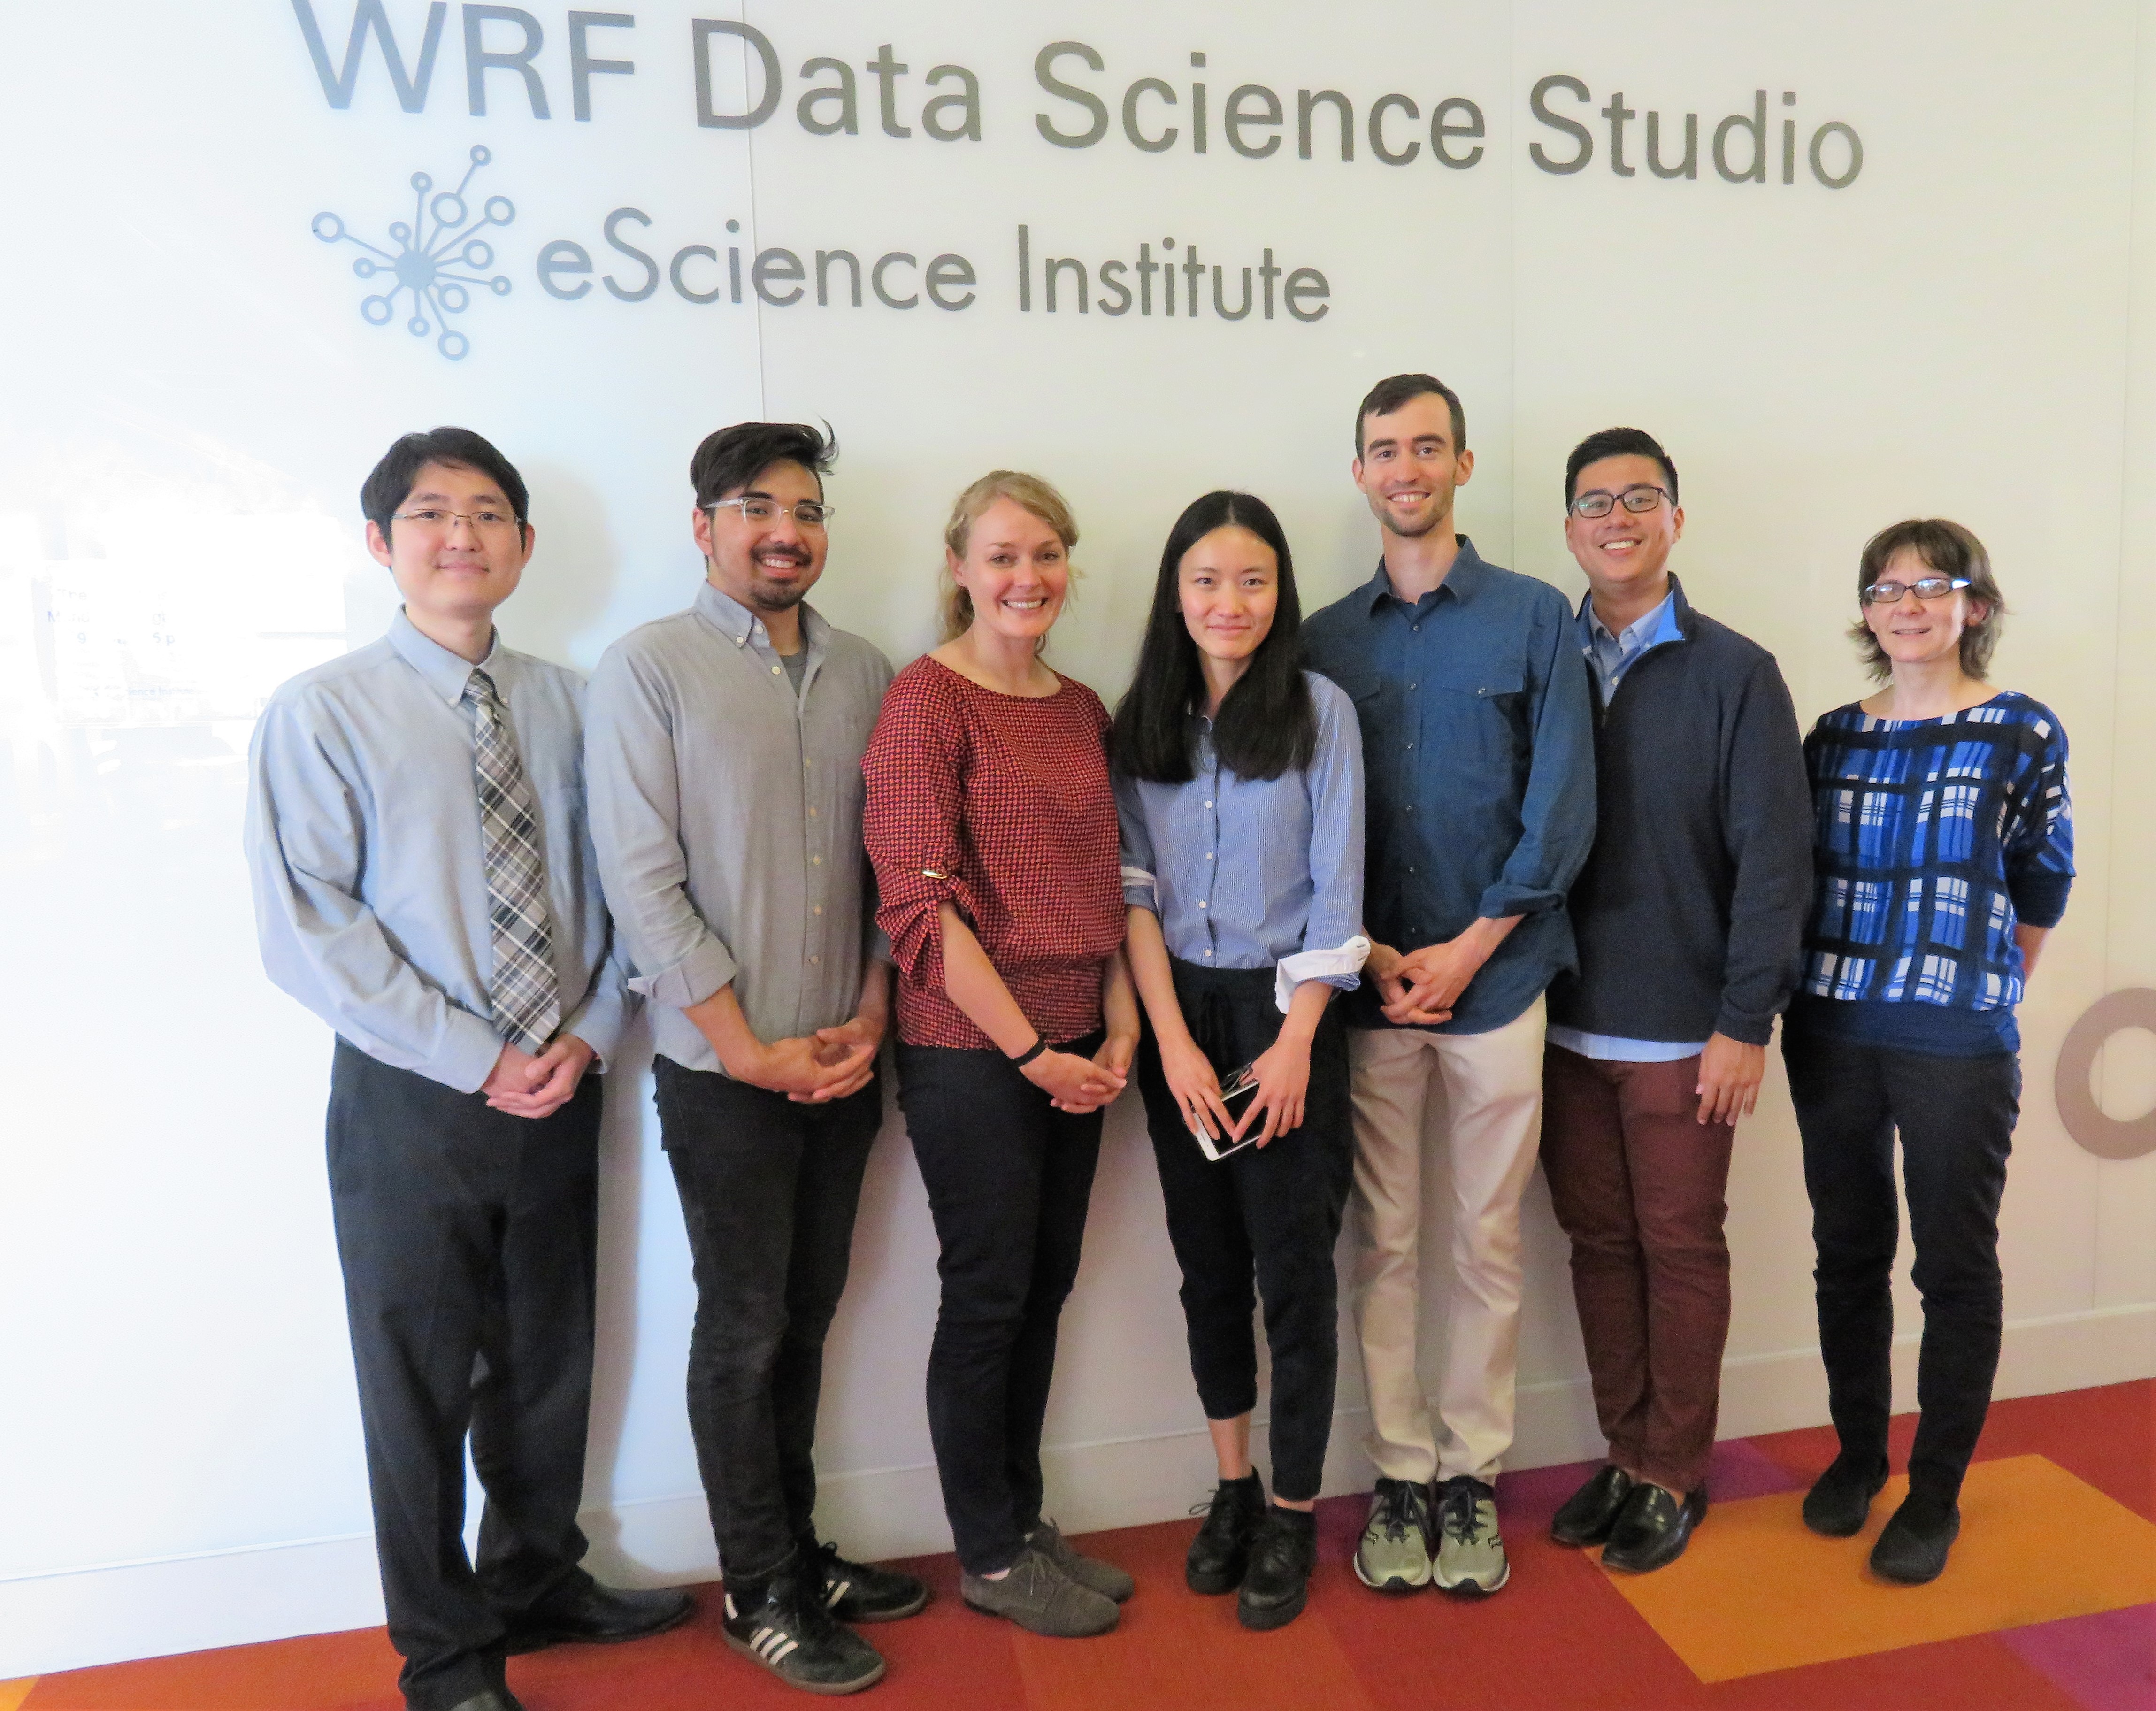
This project generated automated methods to improve the current response to natural disasters – which consists of land surveys and the provision of aerial and satellite images to first responders – by annotating images with flags to indicate building damage. The team accomplished this by creating an automatic damage detection algorithm with machine learning utilizing multiple imagery data sets from Hurricane Harvey in Houston, Texas in 2017, captured from various levels above ground. Their goal was to speed reaction time and support a more targeted response through improved situational awareness. The project was completed by fellows Sean Chen, Andrew Escay, Tessa Schneider, Christopher Haberland and An Yan, working with data scientist Valentina Staneva of the eScience Institute and project lead Youngjun Choe, UW Assistant Professor in Industrial & Systems Engineering and Director of the Disaster Data Science Lab.
Data sources included open data from the satellite imagery corporation DigitalGlobe, aerial images from the National Oceanic and Atmospheric Administration, Federal Emergency Management Agency damage assessments from the ground, and building footprints created by Microsoft and Oak Ridge National Laboratory. Combining different data sets enabled the team to tie damages to specific buildings, provide quality control and overcome the limitations of individual data sets, such as cloud cover blocking views of the ground in satellite images; data quality variations in volunteer-annotated data; and corrupted or messy data with limited processing. The team used Single Shot MultiBox Detector object detection, a deep learning computer vision task, to distinguish flooded from non-flooded buildings; and data augmentation to increase the size of their training data set. After training the neural network, they achieved a .47 precision rate in the resulting model (on a scale of 0-1). The final training data will be released as a public database with a Geoserver. More information is available on the project’s Github page. View the presentation video and slideshow.
Out-of-School Resources Project
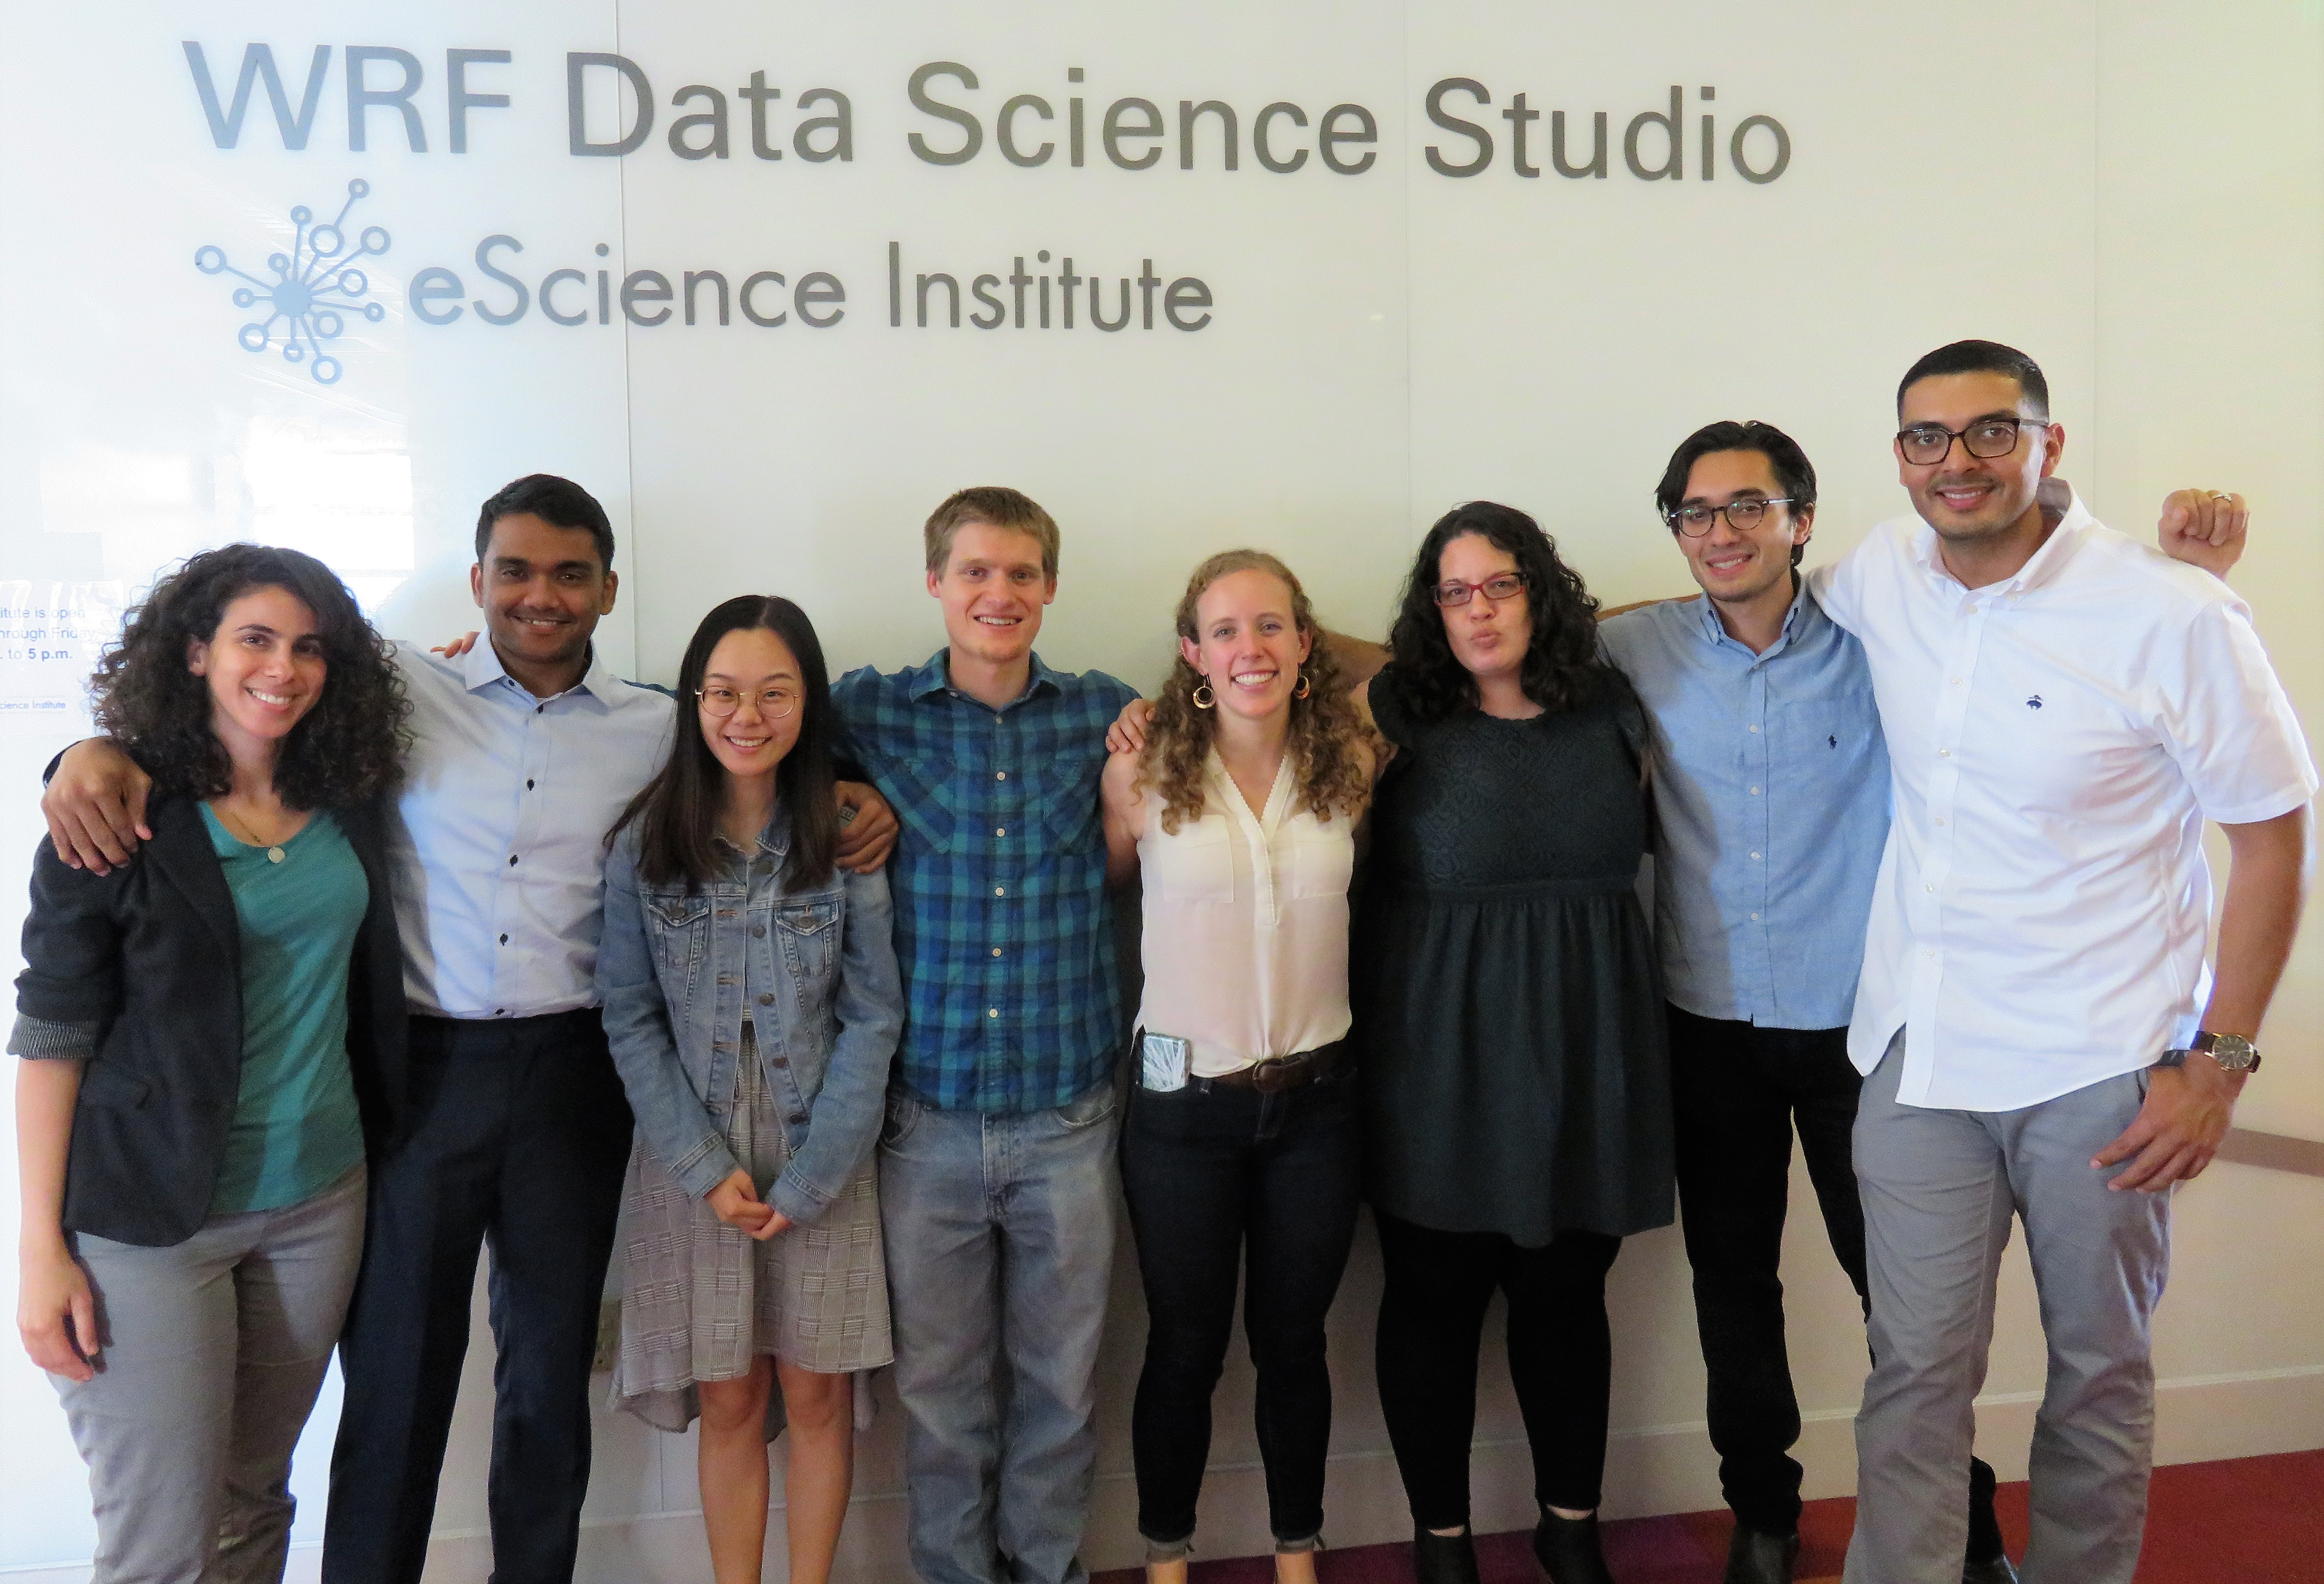
Youth participation in summer programs from hiking and arts to library literacy and math camp has been shown to help reduce a seasonal education slide for K-12 students, supporting enrichment for years to come. But access to programs can be unevenly distributed according to demographic and location factors. The Out-of-School Resources team analyzed access to summer programs in Denver through a partnership with the Center on Reinventing Public Education (CRPE) at UW Bothell and the nonprofit ReSchool Colorado. Fellows Joe Abbate, Sreekanth Krishnaiah, Kellie MacPhee, Andrew Taylor and Haowen Zheng worked with data scientists Jose Hernandez of the eScience Institute, and Karen Lavi, along with project lead Sivan Tuchman, Research Analyst at UW Bothell, CRPE, to identify the distribution of out-of-school educational opportunities across Denver in support of equal access.
Data sources included: 1. Program data and user search data (collected using Google Analytics) from ReSchool’s Blueprint4Summer website, which provides a search tool for Denver summer programs. 2. Data on parks, athletic fields and libraries from the Denver Open Data Catalog, as well as museums. 3. Demographic data such as median household income, race and ethnicity, education levels and age from the U.S. Census Bureau’s American Community Survey. 4. Denver Public Schools data on disability status, English language learners and race and ethnicity, along with a subset of de-identified data on student home location categorized by Census block groups.
To quantify access, the team created an Access Index from 0-100 based on driving and public transit time between Denver’s Census block groups and programs, which depreciates based on a gravity-based decay function to show declines in access with increased travel time. They built an interactive R Shiny dashboard for data visualization and analysis. The team found that access is concentrated primarily in the downtown and central north areas and affluent suburbs in the central southeast region. Examining demographics, they found that the number of black students is consistently correlated with lower access for all program categories; the percentage of white students in each block group correlates with much higher access to fee-based programs; free programs are correlated with higher access for Hispanic students; and higher access areas are correlated with higher incomes and educational attainment.
The team recommended creating more free programs in the largely Hispanic southwest neighborhoods where residents have a low median income and high number of student-age children compared to the city average; and creating more programs in the Green Valley Ranch neighborhood, which has a high number of students with limited programs. The data used to create the dashboard is available on the team’s Github page. View the presentation video and slideshow.
Seattle Mobility Index Project
This project examined the affordability and reliability of trips to every day destinations using different travel modes (driving, public transit, biking and walking); and created a comprehensive baseline measure for comparative analysis of transportation across Seattle from the city’s 481 Census block groups. Destinations included citywide points of interest (employment centers, public colleges, cultural centers and landmarks) and travel points that are common to specific neighborhoods (schools, hospitals, pharmacy, library, parks and grocery stores). The results are intended to measure and identify disparity in mobility to drive policy and improve equity.
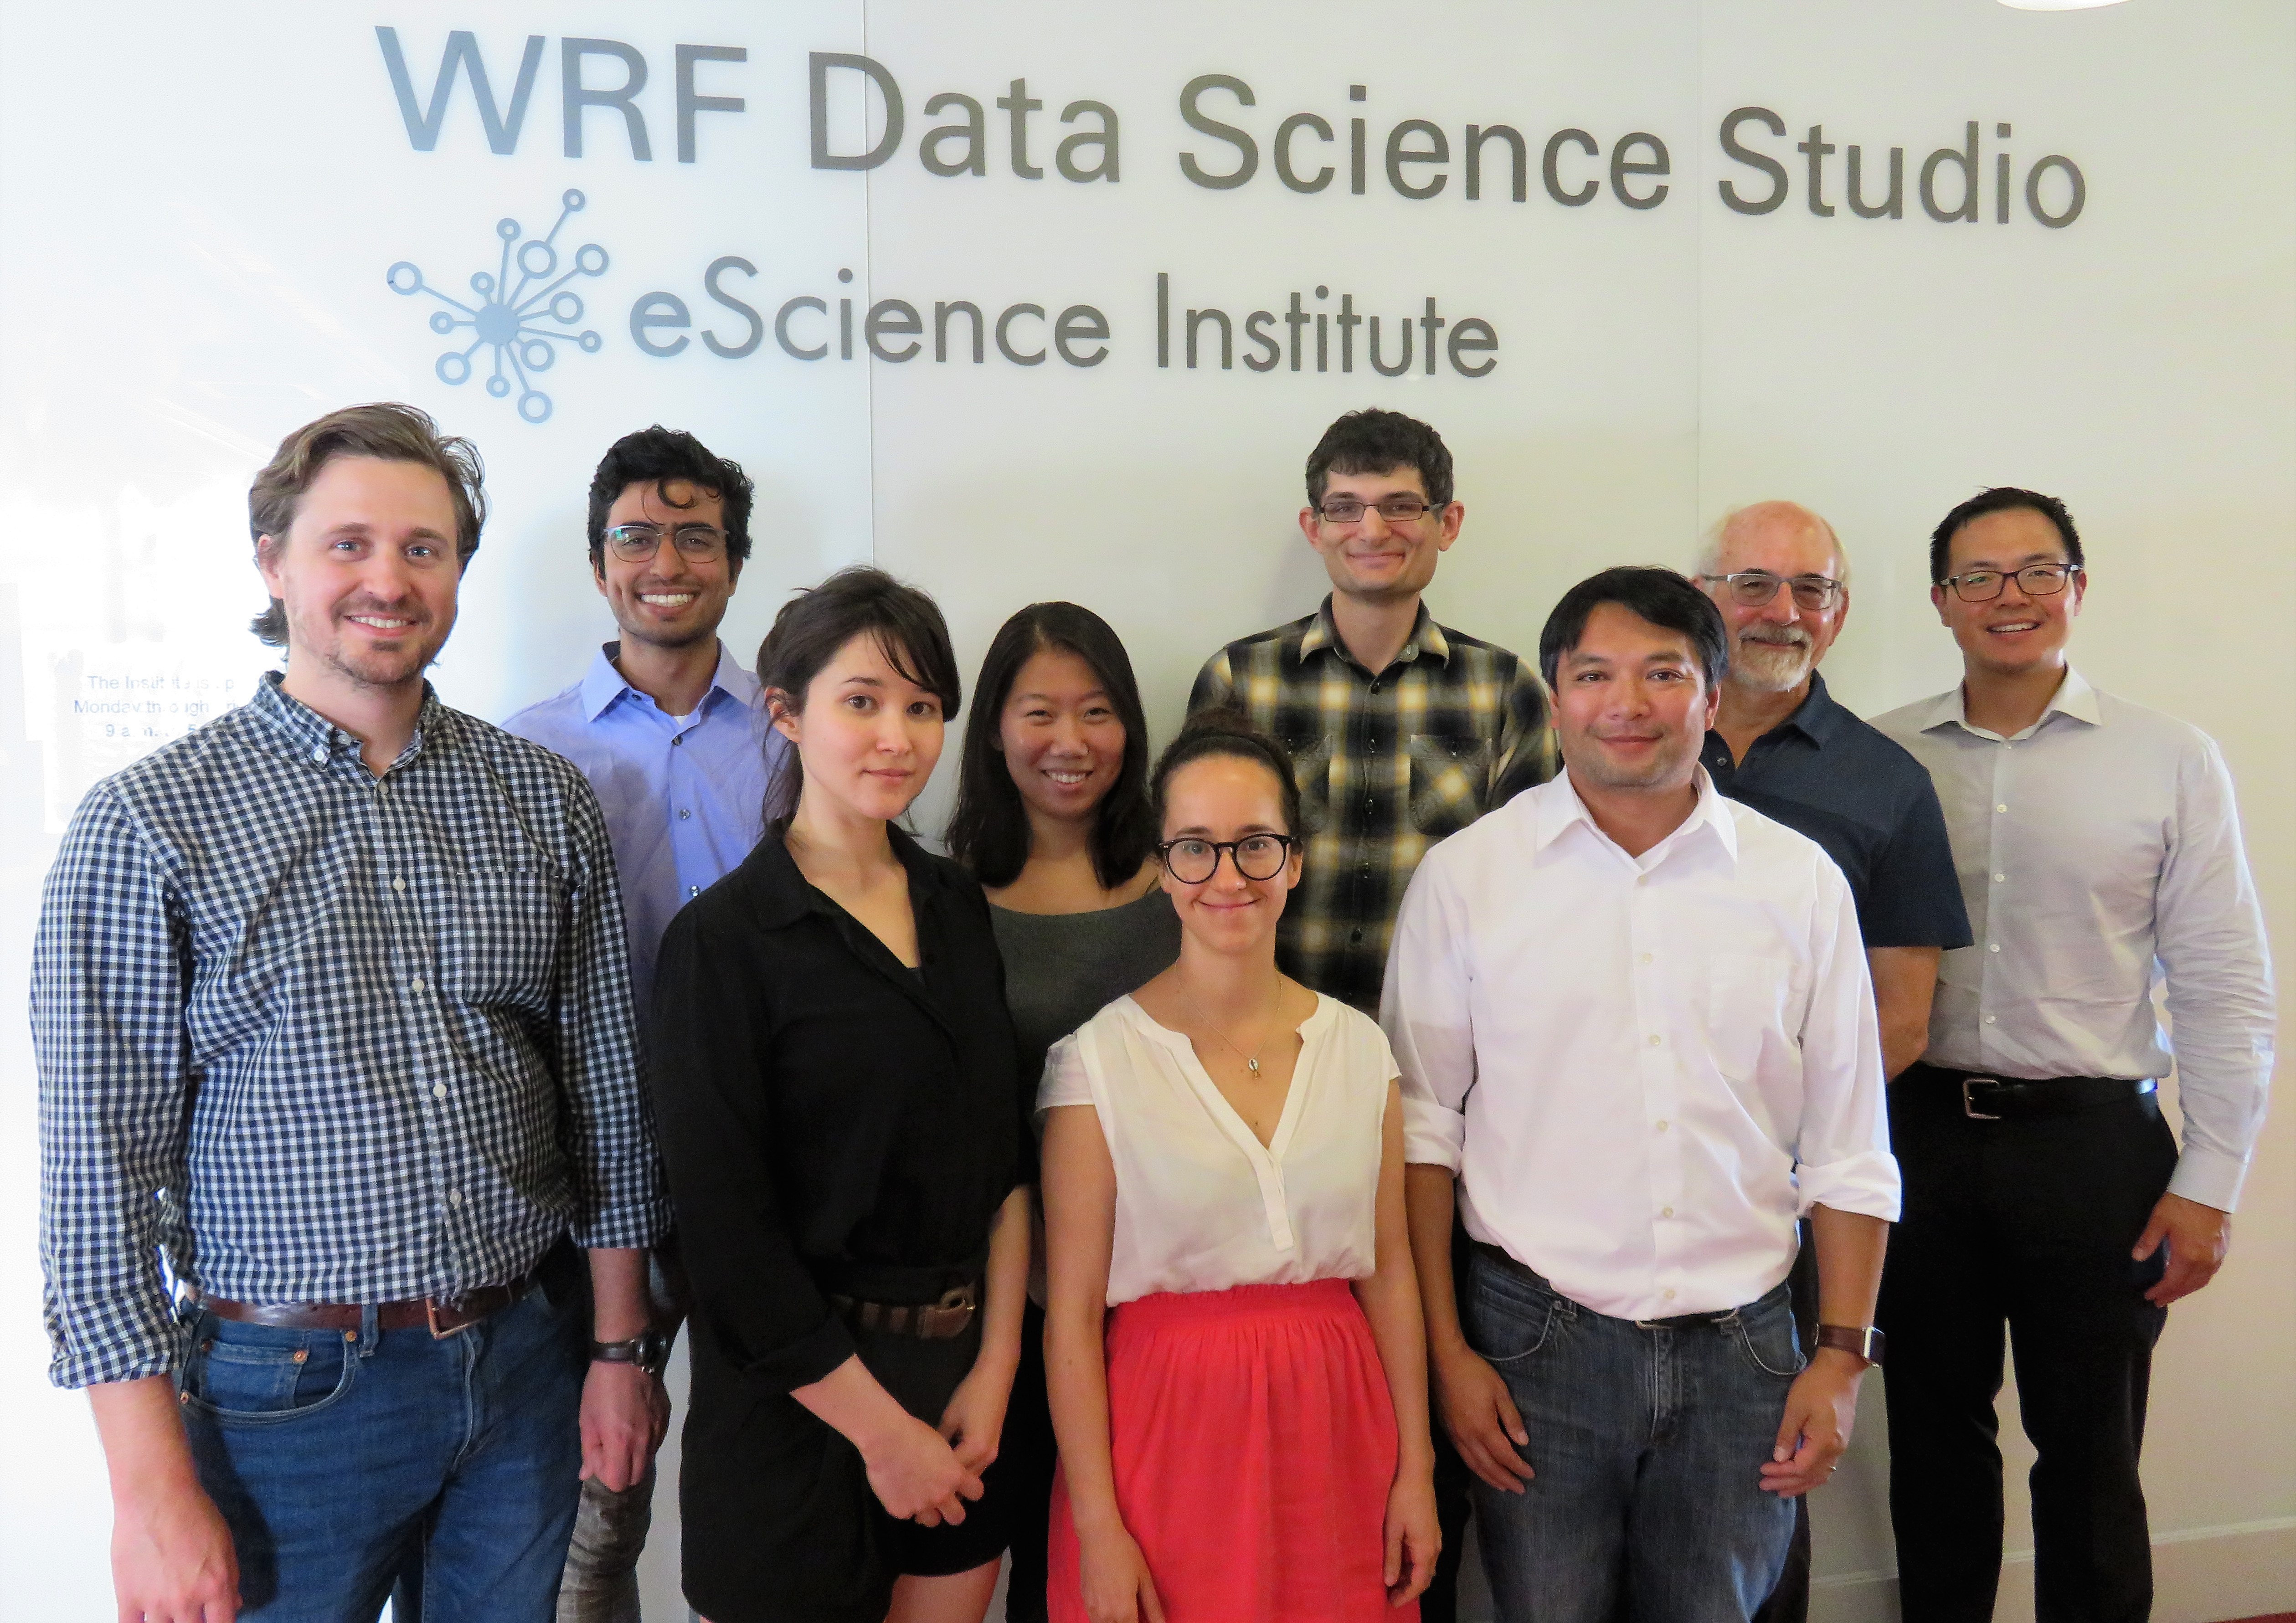
Fellows Rebeca de Buen Kalman, Darius Irani, Hyeon Jeong Kim, Woosub Shin and Amandalynne Paullada worked with eScience Institute data scientists Joseph Hellerstein and Ryan Maas. Project leads from the Seattle Department of Transportation (SDOT) were Data Scientist Stephen Barham and Data Librarian Alex Hagenah, with Intern Akoly Vongdala. The team gathered data from the Google Distance Matrix API, which provides duration and distance between start and end points. They calibrated and trained their model using the Puget Sound Regional Council’s Household Travel survey, which provides information about 30,000 different trips within Seattle logged by 3,000 households, along with household income, home ownership status, race and gender. Census employment data and City of Seattle open data were also used.
The team created a “market basket” of 25 common destinations for each block group to measure mode choice, affordability and reliability. The affordability index accounted for parking costs, transit fees and the $14.10 hourly value for travel time set by the U.S. Department of Transportation. The reliability index is a measure of consistency and travel duration at a given time across multiple days. The team identified 5 travel personas to understand travel choices associated with characteristics such as income and car ownership; and completed a case study of the University District. Using these measures, they were able to predict with 77% accuracy whether a specific trip will be completed via driving versus other modes of travel. The tool will now be handed over to SDOT for further development. View the presentation video and slideshow.
View 2018 project descriptions and outcomes here.
The DSSG program is sponsored by the eScience Institute in collaboration with the Cascadia Urban Analytics Cooperative (CUAC), Urban@UW, and Microsoft. Fellowship applications and project proposals for the 2019 DSSG session will open in January – check the eScience Institute’s website for more information.