This summer series will highlight weekly blog posts from this year’s UW Data Science for Social Good Fellows.
“Why data scientists should care about the social good” by Darius Irani, 2018 Data Science for Social Good Fellow

In the age of big data, insights from traditional domain fields are inspiring solutions to seemingly unrelated problems. I am a Data Science for Social Good (DSSG) Student Fellow within the UW eScience Institute’s 2018 cohort. My cohort consists of 15 undergraduate to PhD level students of diverse backgrounds, including mathematics, computer science, public policy, linguistics, and biology. The DSSG program is exciting because it facilitates sharing of domain experience and exploration of ethical consequences to data science.
Big data opens the door for using well-studied patterns and practices to address complex social problems, from policing to ensuring well-being of refugees. With this great opportunity, unprecedented ethical challenges have also arisen. Consider two cases: (1) an anthropologist from UCLA who borrowed insights from seismic software to predict crime progression and (2) an astrophysicist and mathematician from Johns Hopkins University (JHU) who applied statistical techniques from galaxy clustering to predict abandonment of homes.
For the first case, PredPol, designed by UCLA anthropology professor Jeffrey Brantingham, is a predictive policing software designed to be race and ethnicity blind by targeting geography rather than individuals (Cathy O’Neil, Weapons of Math Destruction). By combining the location and type of crimes committed with historic data trends, the software predicts the likelihood and location of additional crime occurrences. For budget-strapped police departments, this is a powerful proposition because it provides information on where to focus efforts and resources. Sounds good, right?
In Weapons of Math Destruction, Cathy O’Neil shows how PredPol, and other examples of predictive policing software, systematically perpetuate criminal justice inequality. As all statisticians know, statistical outcomes are a function of the input data and reflect what is observed. However, they are not free from error and bias. This makes data-driven algorithms that model human behavior risky, because they may lead to discriminatory results. Statistically, crime is committed at nearly equal rates across racial groups and income brackets. Historically, our criminal justice system has unfairly punished poor and minority Americans. For example, labeled as “prone to criminality”, black males have a 32% chance of being sent to prison at some point during their lifetimes, compared with only 6% for white males (Ta-Nehisi Coates, The Black Family in the Age of Mass Incarceration). With PredPol, these trends may be exacerbated. Despite the designer’s good intentions to be fair, it turns out using geography is a pretty effective proxy for race and ethnicity. As police patrol impoverished neighborhoods at increased rates—where the perceived crime rate is higher—police will no doubt observe drug-use and vagrancy. They make more arrests for low-level crimes, which justifies more policing (Aaron Shapiro “Reform predictive policing”). Thus, when biased data is fed into the model, a dangerous self-validating feedback loop is established that can uproot lives.
In the second case, JHU astrophysicist and mathematician Tamas Budavari and sociologist and mathematician Philip Garboden are creating a database for Baltimore’s housing stock using publicly available datasets and GIS software (Linda Poon, Using Astronomy To Fight Urban Blight). With the U.S. Census Bureau finding 16% of its housing stock vacant, Baltimore needs innovative strategies for addressing these vacancies and the economic issues they represent (Terrence McCoy, Baltimore has more than 16,000 vacant houses. Why can’t the homeless move in?). Potential outcomes for this project include demolishing buildings at risk of collapse and introducing policy interventions that address the patterns which lead to abandonment.
Razing dilapidated housing and replacing it with new development is already part of Baltimore’s strategy for addressing its housing stock (Carrie Wells, Five years in, city Vacants to Value program showing mixed results). An objective of this project is to determine a strategy for demolishing buildings that truly require it for safety concerns. Baltimore Housing and Deputy Commissioner Michael Braverman described the motivation being to model the effects of potential demolitions without having to relocate any residents. This project is not perfect; for example, from my personal experience, I have heard questions about its accountability within the community and its decision-making transparency.
During our first week of the DSSG program, we defined data science for social good as the intersection of statistics, programming, domain knowledge, and ethics. Missing any one of these areas results in a flawed data solution that could have unintended social consequences. Data scientists should care about the social good for three reasons: (1) it’s their ethical responsibility as the knowledgeable designers of algorithms to ensure that their calculations remain transparent and that checks are in place when their clients assume ownership, (2) they can contribute to scientific discovery, as understanding the full social context of the problems leads to better, more innovative solutions, and (3) it’s an exciting challenge to think of and address potential misuses, and feels good to create a product that helps people.
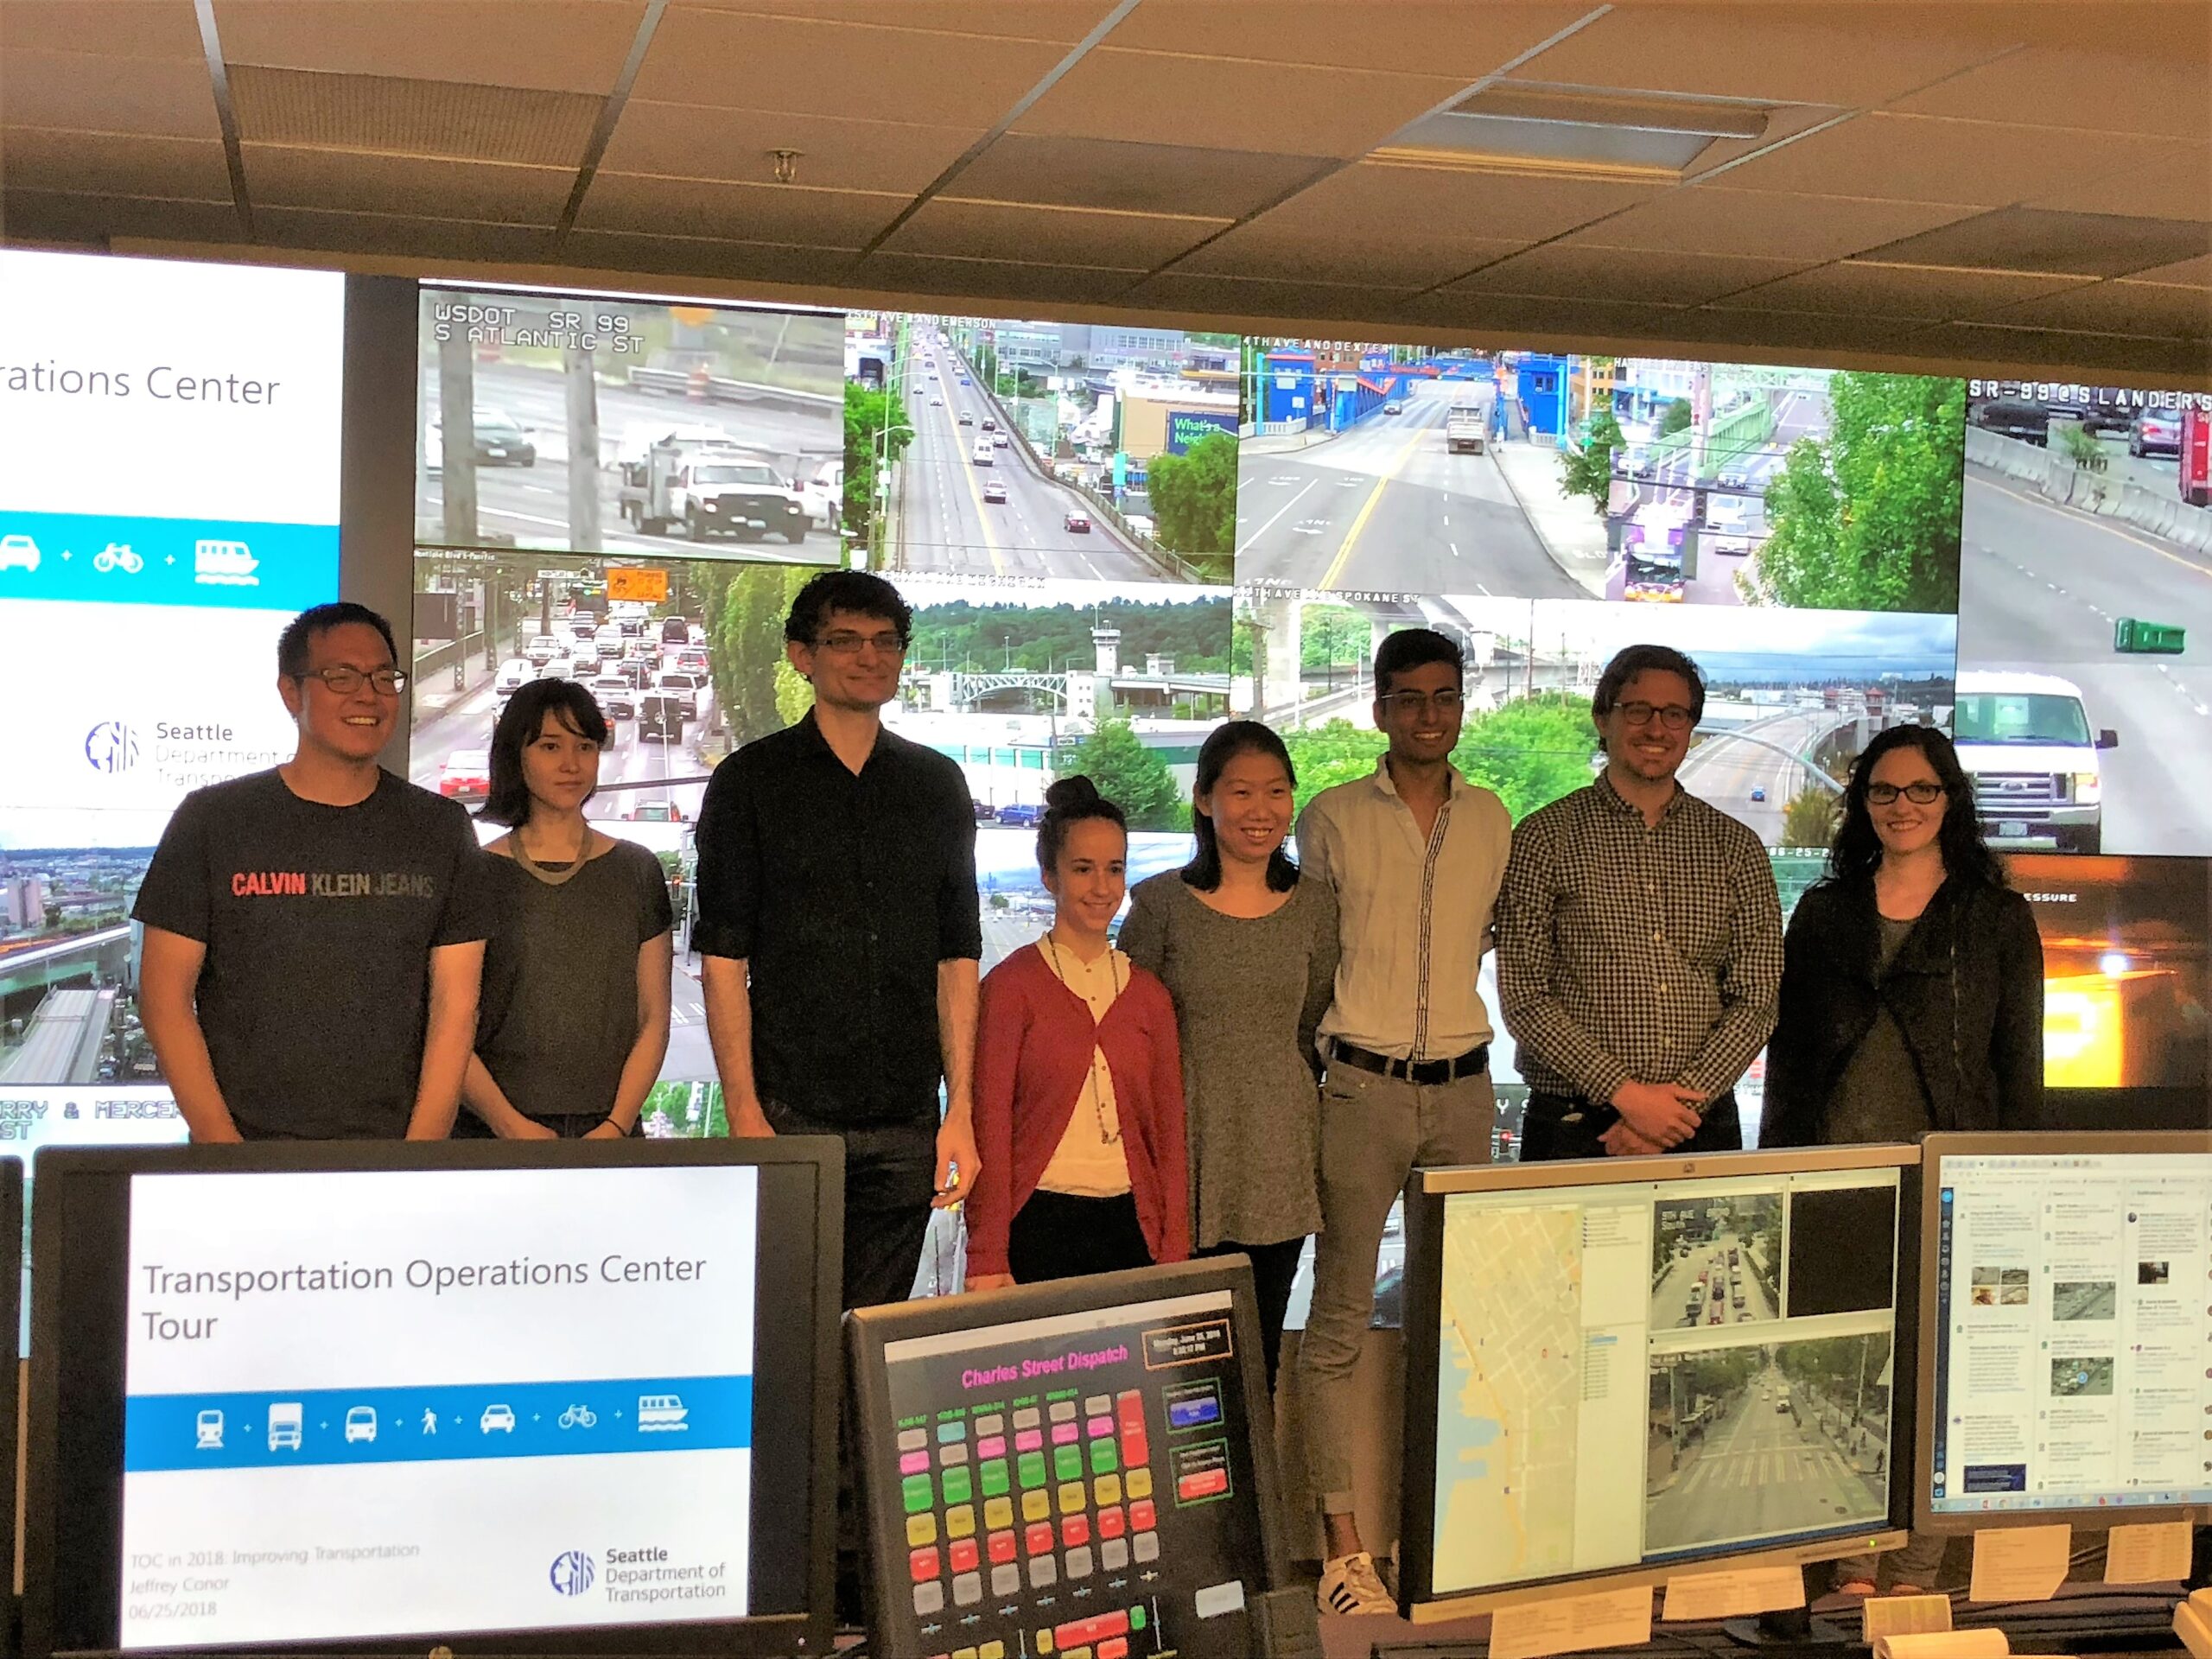
I am working with the Seattle Mobility Index team to analyze travel patterns and develop scalable algorithms that return indices on travel mode choice, affordability, and reliability. These indices will be used to model and predict the probability a traveler will utilize different modes of travel and inform future policy decisions. During our first meeting with the Seattle Department of Transportation and Mayor’s Office, our stakeholders voiced concern over the the indices being used to advertise real estate rather than improve efficiency and equity of transportation as the primary risk. Following this, we defined proper use cases and what are indices are and are not. As our technology is open source, it is important we document proper uses well so that it is easy to understand.
Data science can help solve complex social issues by using insights from fields we’ve studied for decades, which is good. But it can also contribute to an automation of inequality if social consequences are not considered (Virginia Eubanks, Automating Inequality). In the age of big data, data scientists no longer have an unconstrained charge for advancing science. They are now also accountable for ensuring their science is being used responsibly and for equitable outcomes.
————
“Is R or Python programming important for policy analysts?” by Andrew Taylor, 2018 Data Science for Social Good Fellow

The short answer is an obvious – “yes, of course.”
The more interesting question, at least one that kept me up at night as I pushed my way through quantitative analysis and experimental design courses in my Masters program, is something like-
“What can R or Python offer me as a policy analyst in the public sector?”
The answer, again is simply “a lot,” which brings us to an important and extremely wonky question about trade-offs that reads something like-
“Is it worth it for me to learn R and Python if I’m going to be working in the public sector?”
At least while I was pursuing a Master’s of Public Administration (MPA) in 2017, this was an open debate among my colleagues and professors.
If you’re a student in a MPA or Masters of Public Policy Analysis (MPP) program, there’s a good chance your analytics courses were taught using Stata, SPSS, or some combination of both. Somebody probably also told you it would be a good idea to learn R or Python. However, if your experience was anything like mine, all you really knew about the tradeoff between R/Python vs. Stata/SPSS was that the former was newer, sexier, and harder to learn. You probably also don’t have a lot of spare time, and the prospect of learning a programming language is daunting to say the least. Finally, at least for me, although I knew it would help my resume, it wasn’t clear what I could gain from R or Python that Stata couldn’t offer.
Even more importantly, if you know anything about the world of government or non-profit analysts, you probably also know that the industry standard for statistical analysis platforms right now is far from decided. I’ve personally worked with extremely accomplished analysts in nonprofits and government positions who work off of everything from strictly Excel with stats packages plugged in, to accomplished SASS, R, and Python programmers. The success of analysts in public sector careers doesn’t seem to be strictly determined by their choice of analysis platform. At least for now.
So if you’re wondering if it’s worth it to brave the world of Data Camp and/or out-of-major University electives to learn R, Python, or both, allow me to give an enthusiastic:
“Yes, definitely”
-and I’ll share some experience as to why:
1. Learning R and Python brings you into a community of analysts, academics, and developers
There are way more users of R and/or Python than there are of Stata. Just about any question about how to accomplish a task in either can be solved using Stackoverflow. If you’ve ever spent hours flipping through an out-of-date Stata textbook, you know this is a big deal.
More abstractly, by far, one of the greatest experiences I’ve had in the DSSG program is working with such an interdisciplinary team. Public policy programs tend to be interdisciplinary, but in my experience we still rarely work with mathematicians, physicists, or sociologists, just to name a few of the backgrounds on our team. For whatever reason, tools like R and Python, are things that bring together our experience, and help to facilitate learning from each others backgrounds.
On a much simpler level, using R and/or Python almost certainly means using GitHub, bringing you into a community of developers who have almost certainly written code which you can learn from, if there is a package which specifically addresses your problem. On that note-
2. R and Python allow for the integration of interdisciplinary methods and data sources
Open source programs with a huge following like this don’t just mean more support – they also draw hundreds of thousands of users from many different fields creating packages specifically to address common problems.
For example, as a research assistant, I was once paid to do data entry, pulling a handful of key points off of about 7,000 pages following the same structure. Working only part time, this took weeks to accomplish, and cost my professor around $1,200. In contrast, as part of our DSSG project we assessed social media reviews for Out of School Resources in Denver. Although in the end we didn’t use this particular set of social media data, we modified a web scraping script built for Python for use in a city-specific context, and was able to collect data from about 48,000 pages of the same structure in an afternoon.
As another example, suppose you have a collection of addresses or latitude and longitude coordinates for 300,000 observations, and you want to aggregate these by census block. If there were only a handful of unique points, this could be quick enough to do by hand, but let’s suppose these are 300,000 unique locations, that fit within about 100,000 unique census blocks. To my knowledge there’s no Stata function that determines census block based on spatial location. You could spend an entire day using an error prone method of attempting to match all of these by hand. Or, as we’ve done in our current DSSG project, you could use an only slightly modified version of the code provided in a stackoverflow answer and be done with this aggregation in an hour.
There are a plethora of very specific skills required to collect certain data in today’s world. It’s probably an absurd idea for me to learn how to become an expert web scraper, or even take a web scraping course. Understanding R and Python means access to a community of experts who share their code for methods foreign to my training, which not only lowers the opportunity cost of exploring these methods, but introduces me to new approaches I never would have considered before.
3. R and Python make it easier to work with messy, administrative data
There’s no such thing as a panacea for administrative data. At the end of the day, most of the time a bad input or missing data can still be a prohibitive problem. However, for many of the most frustrating tasks of administrative data, R or Python can quickly automate and simplify cleaning much more efficiently than Stata, Excel, or SPSS.
For example, I recently worked on a project where the database administrator sharing information with us exported the data incorrectly, providing duplicate observations with systematically missing data. In short, for every unique ID, we had between three and five records, with some combination of the features we requested. What we needed was one record per unique ID with the aggregation of all these features currently treated as unique records. We had about 70,000 records and cleaning this by hand was out of the question per the time constraints of the project. Requesting a subsample of the data was almost guaranteed to reduce the statistical power needed to identify effects for a small sub-population. Using Stata or SPSS we might have been stuck with this trade off. Using R, we were easily able to write a combination of functions and for loops to automate the process of cleaning the data, giving us more time to focus on modeling and visualizing results.
In the end, what you’re going to do as an analyst in the public sector probably matters most. If you’re never going to do any statistical analysis, maybe you don’t need to learn R or Python. But if any point you expect to do rigorous, quantitative analysis of large datasets, learning R or Python programming is only going to make your life easier and your work better.